
The 1 Trade We Took in July (And What We're Eyeballing Tuesday)
Our swing trading system avoided the horrible chop in July. We took just one trade on the last day of the month. Here's exactly what has to happen before we get aggressive again.

MARKET REGIME: RED, but improving · QQQ reclaimed its 10-day Friday ·
We want to see the Qs hold and then reclaim its 50-day for a signal an intermediate-term bottom is in.
July’s chop is finally behind us. We sat most of it out on purpose, and the one trade we did take, $CRWD on Friday, closed the week above our entry. Cybersecurity has been leading the Software sector off the lows and is starting to show some serious follow through while the AI trade sold off in July.
But the market has to prove itself this week. The QQQ just reclaimed its 10-day, and the first valid follow-through day window opens Tuesday. This week tells us if the bottom is real. I cover our trading game plan so we’re prepared for all scenarios.
Here’s what’s inside:
A review of our current portfolio & this week’s focus list.
A breakdown of the Software leaders by sub-group: enterprise, cloud, cybersecurity, inference. The group closed Friday a quarter percent under its 200-day.
The rotation back into the Hyperscaler Mega-Caps now that these earnings reports are finally showing real ROI on the AI spend. The market is laser focused on AI profitability. Watching AMZN MSFT GOOGL.
Two concerning topics that could derail the rally: the 30-year yield just broke a trendline that held since 1988, and energy prices are creeping toward the danger zone.
Also watching Leopold’s top holdings: NBIS, SNDK, MU, CRWV, BE. Friday’s first tag of the 21-days got sold hard, which is exactly why we are just watching for now. Attempt one at resistance usually fails, and we’re interested in what holds after it.
Earnings I care about this week: SNDK, HUT, LLY, TXG, AMD, AAOI, STRL, ALAB, DDOG, NET
⭐My Focus List⭐
SNOW, PANW, FTNT, AMZU, STX
WHERE THE INDEXES SIT
For now, the QQQ daily chart just reclaimed its 10-day moving average, closing at 687.99 with the 10-day sitting at 687.75. That’s a very important first step in the right direction. Importantly, the QQQ also just put in its first higher low. The QQQ’s 21-day EMA is right above at 697, then the 50-day at 715.
Let’s see if this week can give us a follow-through day (index up over 1% on higher volume signaling a new uptrend). If we can reclaim that 50-day moving average, we will start to get more aggressive.
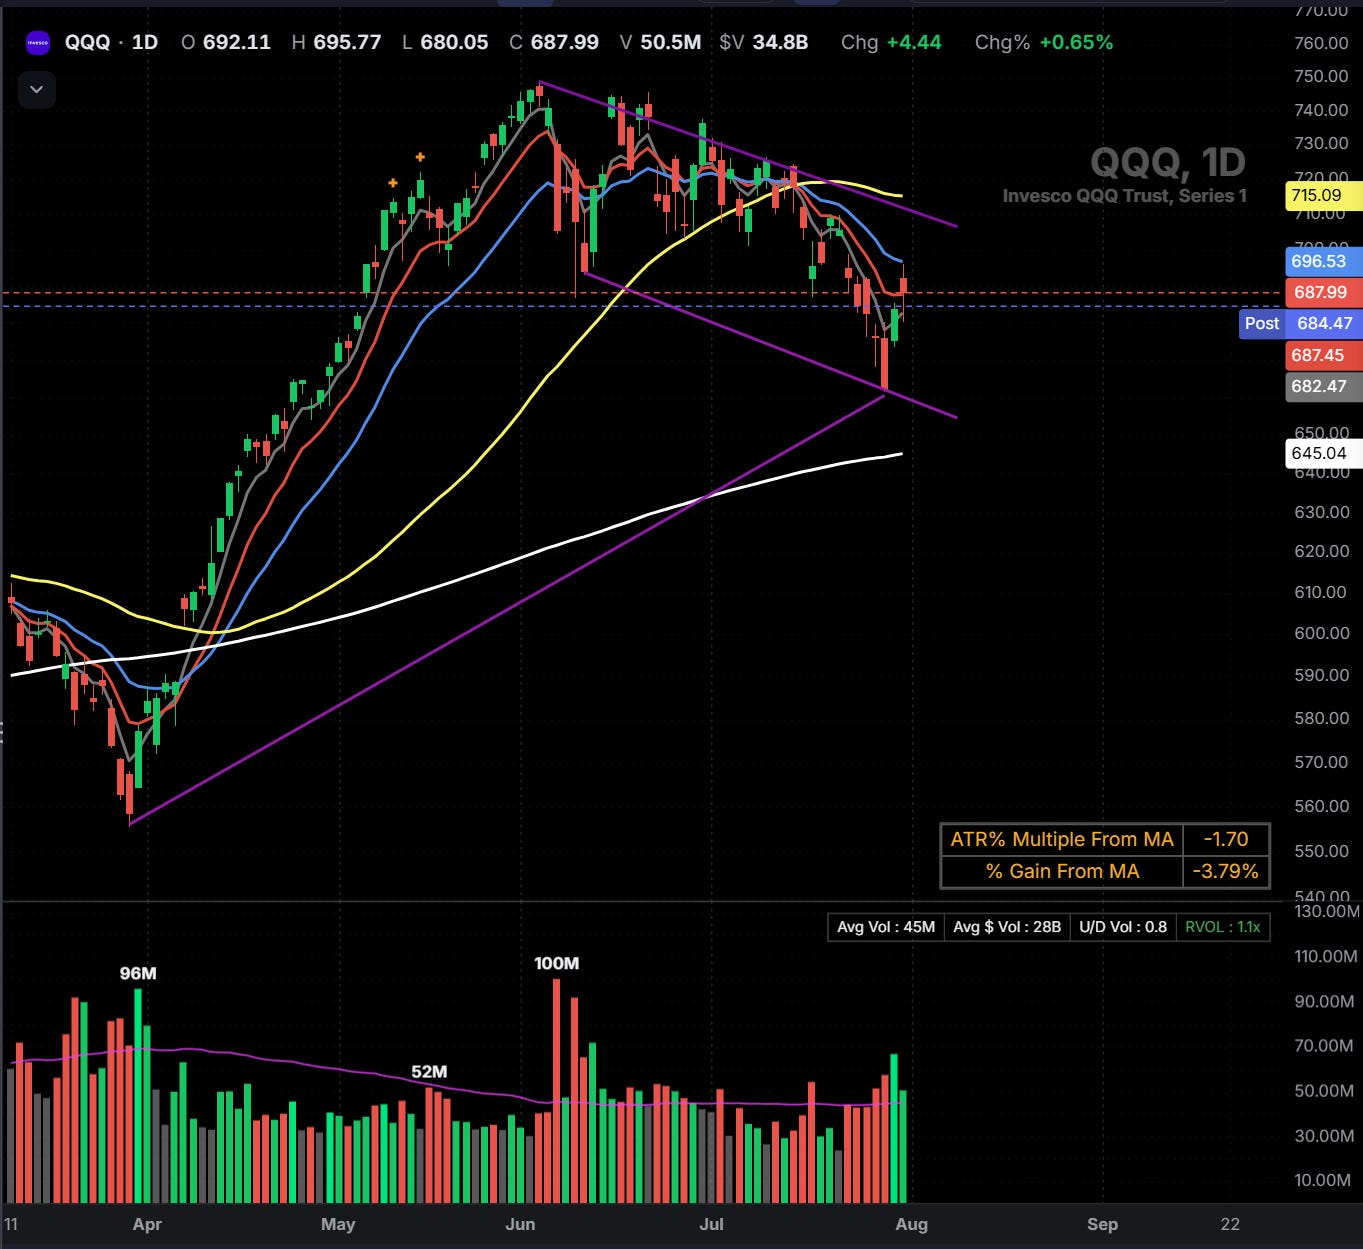
The S&P has held up a lot better than the QQQ. It’s now above all of its key moving averages, and it looks like this thing just wants to keep going.
Worth watching $GOOGL as it sits at 356 against its 50-day at 359. If the generals start reclaiming their institutional lines, the whole bottom thesis gets easier to trust.
THE RTL BOOK
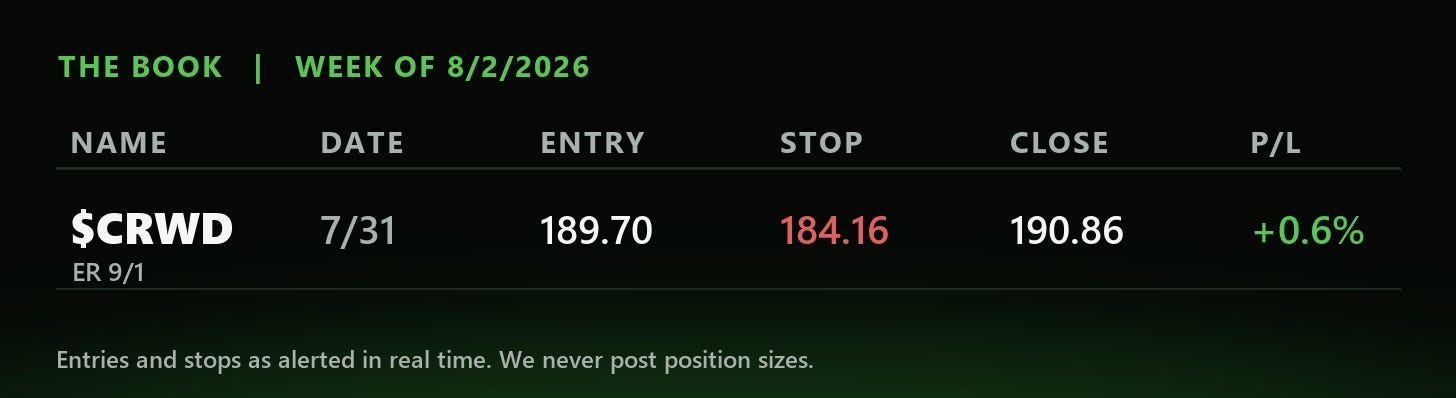
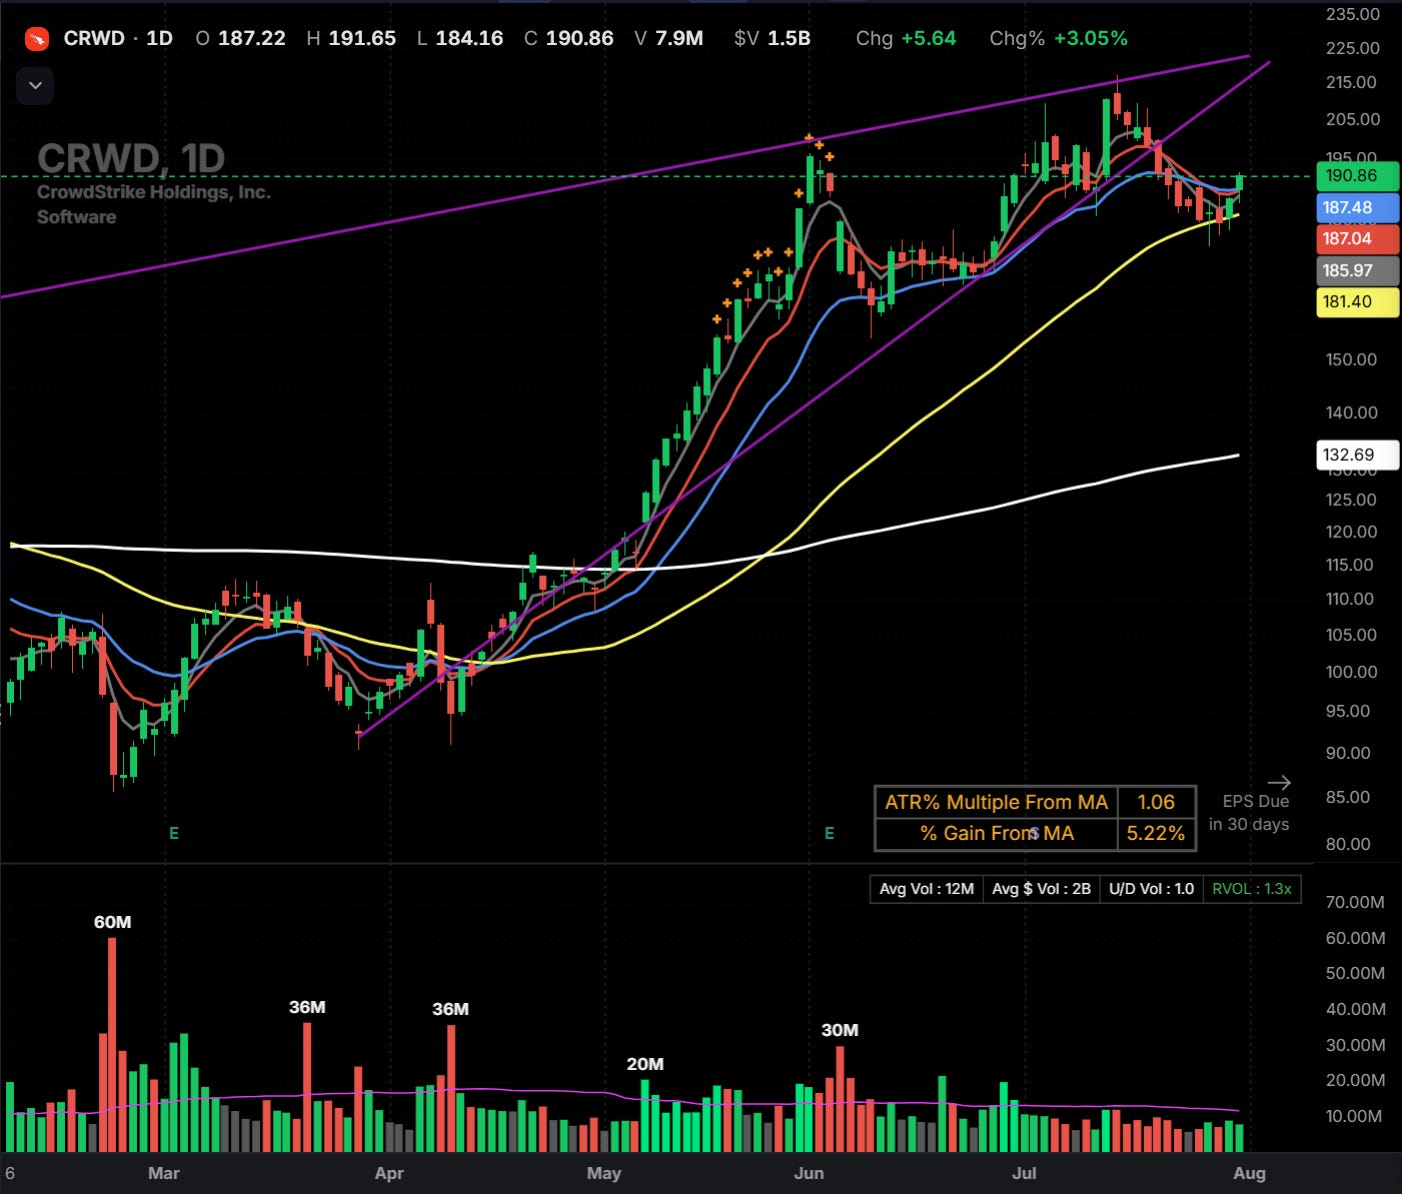
CrowdStrike is a top holding in the cybersecurity ETFs. We took our position Friday as it broke out above its downtrend line, got knocked back, then reclaimed and broke out again the same day. That’s exactly what you want to see. Serious relative strength in this name, on a day the group had every excuse to stay down. Earnings September 1st, so this one has room to work.
We are waiting for the Qs to reclaim their 21-ema and 50-dma before getting more aggressive in adding exposure.
THE INSTITUTIONAL LINE: THE 50-DAY
William O’Neil looked for leading indexes and leading stocks to repeatedly find support at or just above their rising 50-day moving averages. He called this the institutional line. A decisive break below the 50-day on heavy volume that can’t recover was a major red flag: it means the mutual funds and pension funds are aggressively selling.
The moving averages tell you where the index sits now. O’Neil used distribution days to predict when an index was about to break those lines. To spot a top, he tracked sessions where a major index closed lower than the previous day on higher volume.
Four or five distinct distribution days inside a two-to-three-week window was his tipping point, a warning that the trend is topping even while the index still sits above its 50-day.
One more O’Neil rule that matters right here: don’t buy the dip, and never average down, while the major indexes trade below a falling 50-day or 200-day moving average. He waited for a confirmed follow-through day to signal a new valid uptrend before putting money to work.
The first valid follow-through day window opens this Tuesday. We want a 1% or greater move on strong volume. That’s when we start getting more aggressive in this market.
THE TWO BLACK SWANS
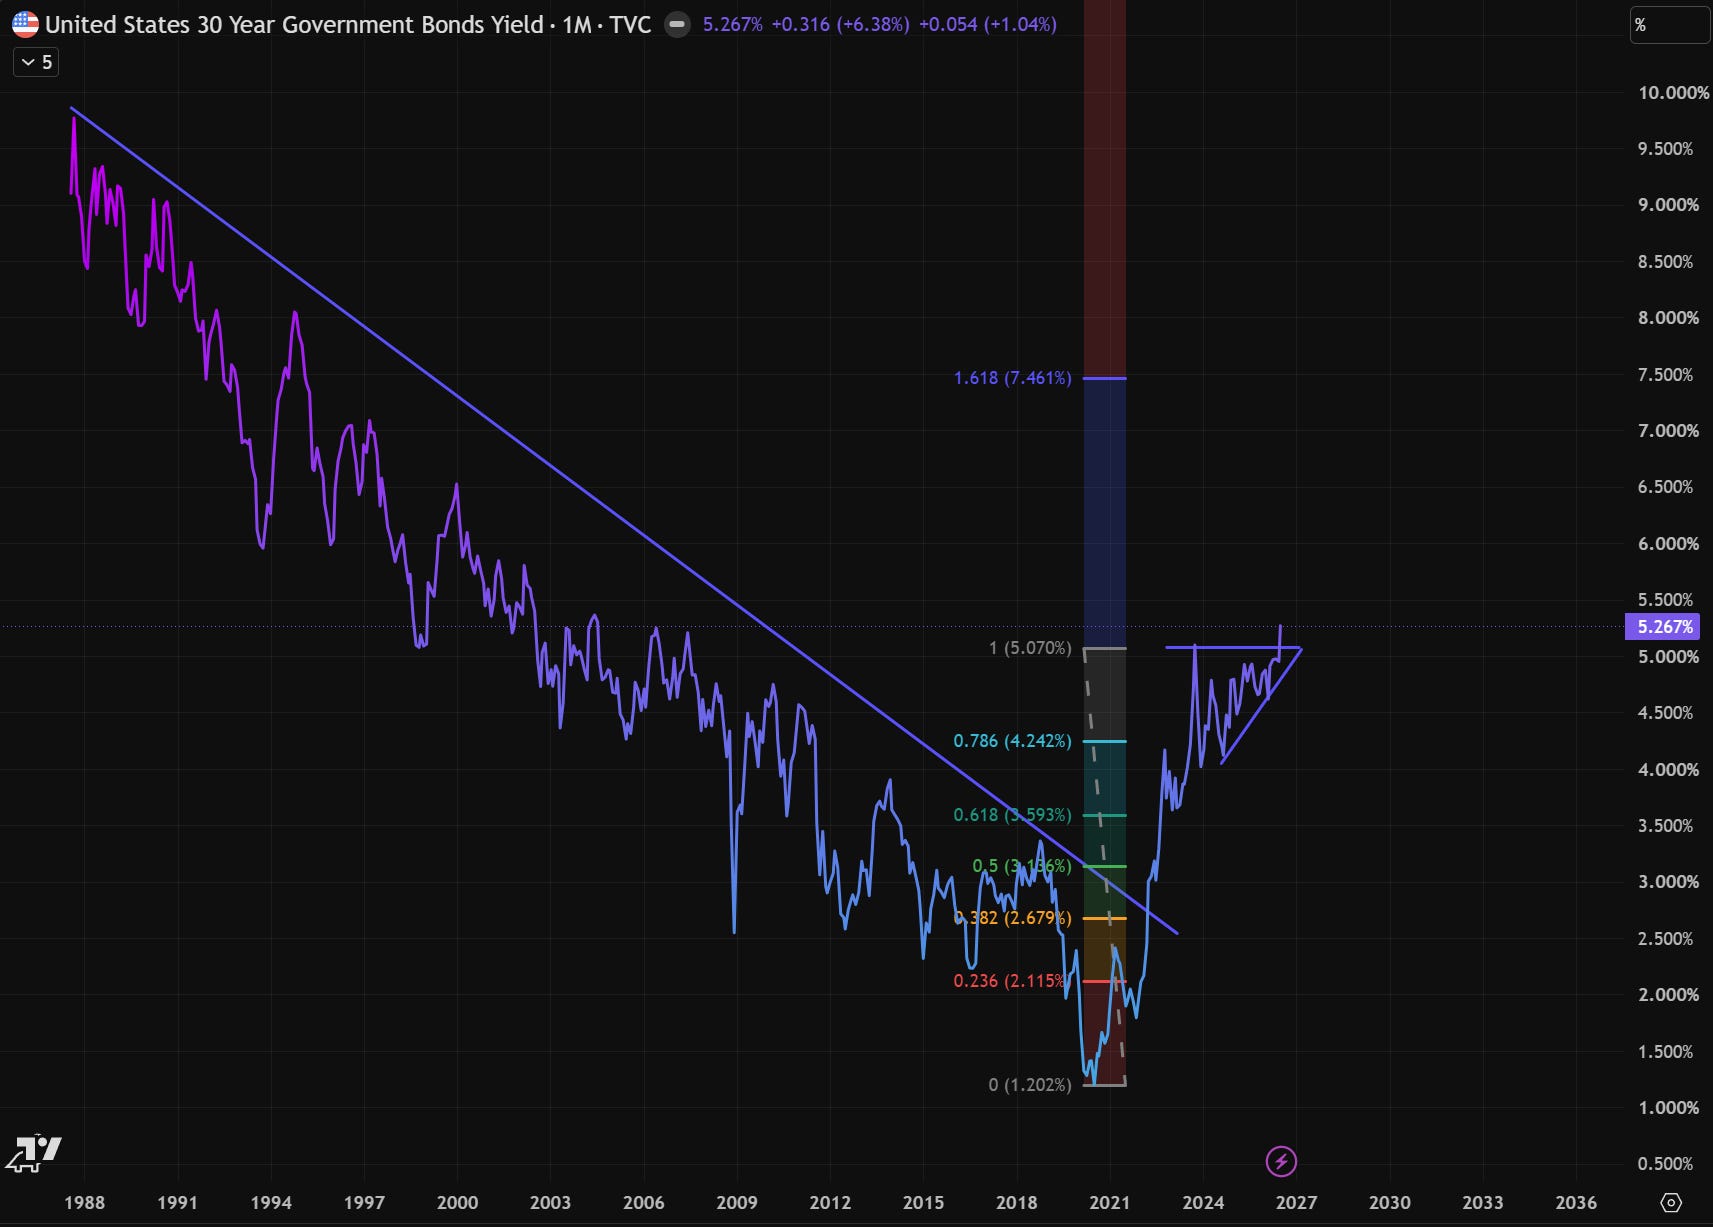
Our two biggest concerns that could derail a rally are longer-dated Treasury yields breaking out to new highs and higher oil prices. We think this is a potential black-swan issue for markets and we are watching it closely. Friday morning was the live demonstration: the 30-year probed its highs and every long-duration software name got hit at once, before the indexes clawed it all back by the close.
Yield risk. The breakout in longer-dated treasury yields is concerning. The long-term trend line that hasn’t broken resistance since tracking started in 1988 broke out. Fibonacci levels point to over ~7% yield if the breakout keeps running.
A lot of what’s turning up is rate-sensitive: financials, real estate, homebuilders coming out of stage 1 bases. And every long-duration growth name on our list lives off the same yields. All of it depends on the bond market behaving, and the bond market is not cooperating. $TLT closed 36 cents off its 52-week low, below every falling average. Long yields are pressing their highs.
If yields spike from here, the new leadership gets cut down before it matures. Homebuilders may already be feeling it, $XHB closed below its 50-day while $KRE sits 2.6% off highs. Watch $TLT. A break of 81.89 and the rate-sensitive names on our list get a shorter leash.
Oil risk. Brent pushed higher again Friday and closed near 88. Energy is a group we’d trade long but the risk is what crude at these levels does to everything else. Oil up here feeds the inflation prints, inflation feeds yields, and yields are the thread this whole rotation hangs by. Somewhere above 100 it stops being an energy trade and becomes a market problem. Until then energy stays a group we trade long, and crude stays a number we check every morning before trusting the rest of the list.
THE HYPERSCALER PRINTS: ROI IS THE NARRATIVE NOW
Big tech earnings finally showed us what this market cares about. All three hyperscalers are growing cloud faster than last quarter. Google Cloud grew 82%, Azure 43%, and AWS 37% against 31% expected, its fastest growth since 2021. They are all spending historic amounts too. Amazon guided 2026 capex to 220 billion and called out higher memory prices as part of the reason.
Here’s how the market sorted them out. If the spend is clearly driving revenue, you got bought.
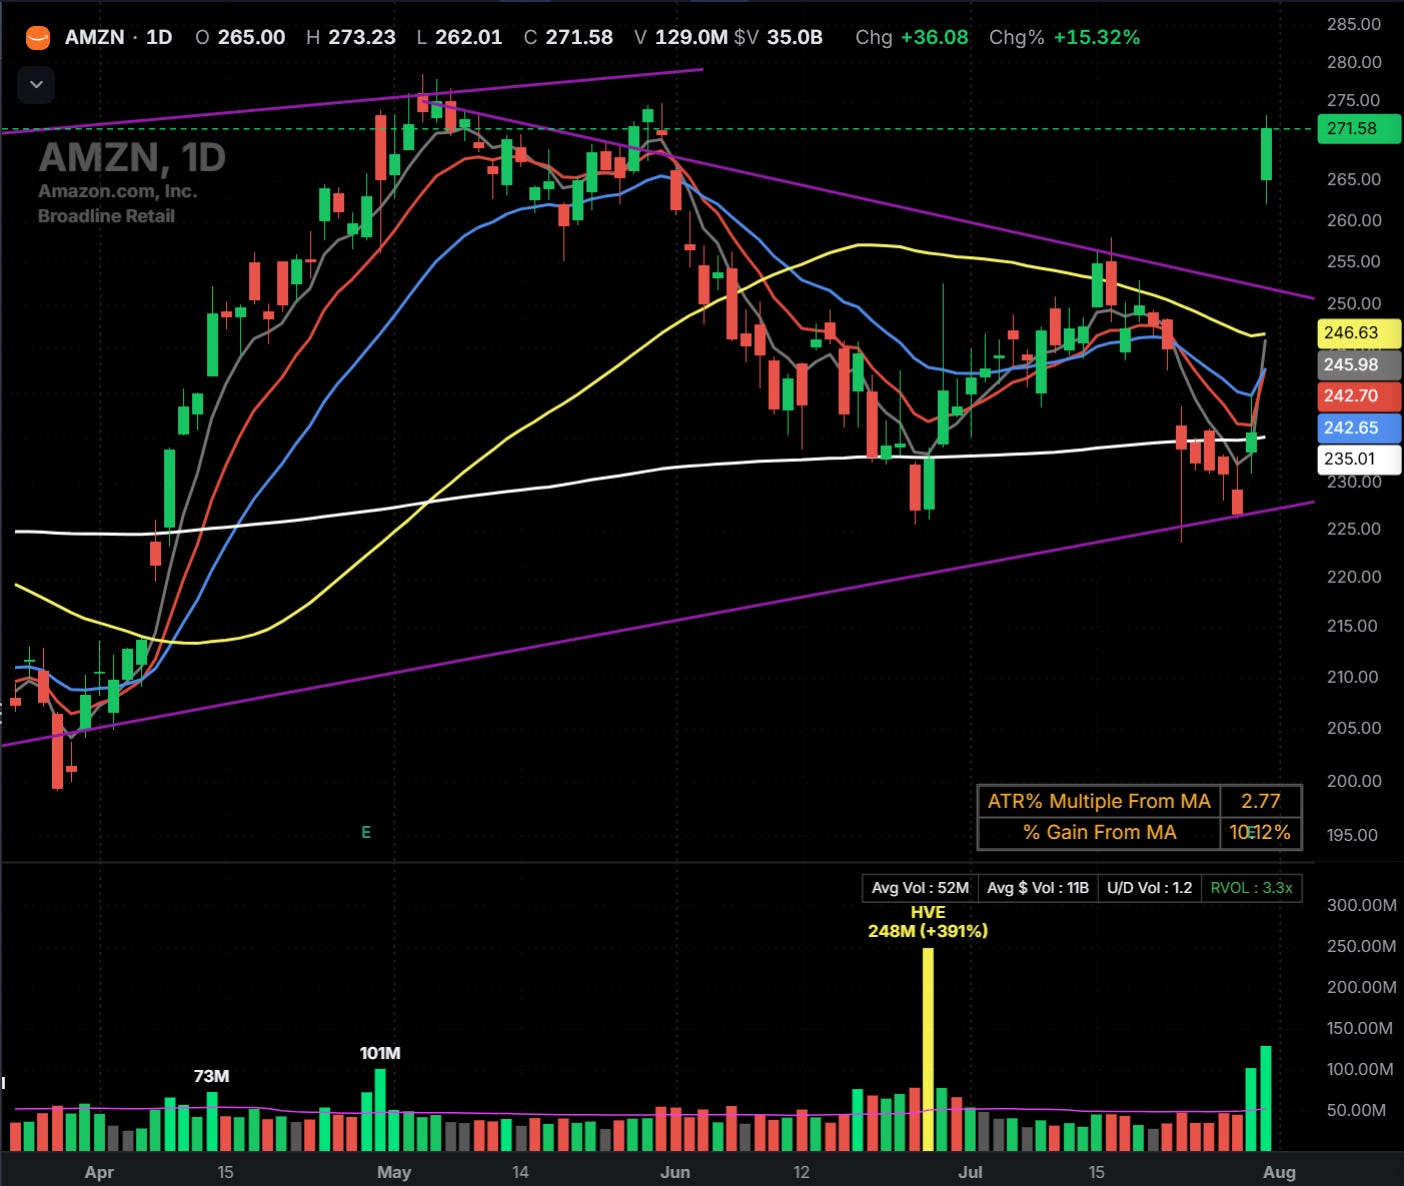
$AMZN gapped up 15% Friday and closed at 271.58, 2.5% off all-time highs. That’s now the strongest big-cap chart in the market.
$MSFT gapped up midweek on the Azure number and closed the week at 464.72, repairing nicely.
$GOOGL actually got sold on its capex guide despite growing cloud 82%, then spent the rest of the week rallying back to its 50-day at 356.
$META spent like the others but doesn’t have a usage-based revenue line to point at, and it gapped down hard. The market is grading AI capex print by print now, and it only cares about ROI.
The read-throughs are what matter for us. Consumption is accelerating at all three clouds, and that’s the tide behind the software names on our list. $SNOW, $DDOG and $NET all bill by usage, same as AWS. And Amazon calling out memory costs inside a 220 billion capex guide tells you the demand behind the memory trade is real, even while $MU and $SNDK are broken charts. Demand intact and charts dead can both be true at once. We trade the charts.
Every AI name below the hyperscalers gets asked the same question next. The neoclouds and data center names either show the revenue line the spend maps to or they get sold. One more thing worth noting: if this correction repairs, the generals lead it. $AMZN sitting 2.5% off its highs is showing you the right side first.
SOFTWARE: ONE WORD, FOUR DIFFERENT BUSINESSES
$SNOW, $NET, $DDOG, $CRWD, $PANW, $RNG, $MSFT
Software $IGV started showing legitimate follow-through this week, the first group to do it since the top. $IGV closed Friday within a quarter percent of its 200-day. Through that line and this group is back in Stage 2 territory.
Most investors treat software as one group. It’s actually four. Enterprise apps are the tools companies run on, sold per seat: $MSFT, and the comms names like $RNG. Cloud and data infrastructure is the layer underneath, billed on usage: $SNOW, $DDOG, $NET.
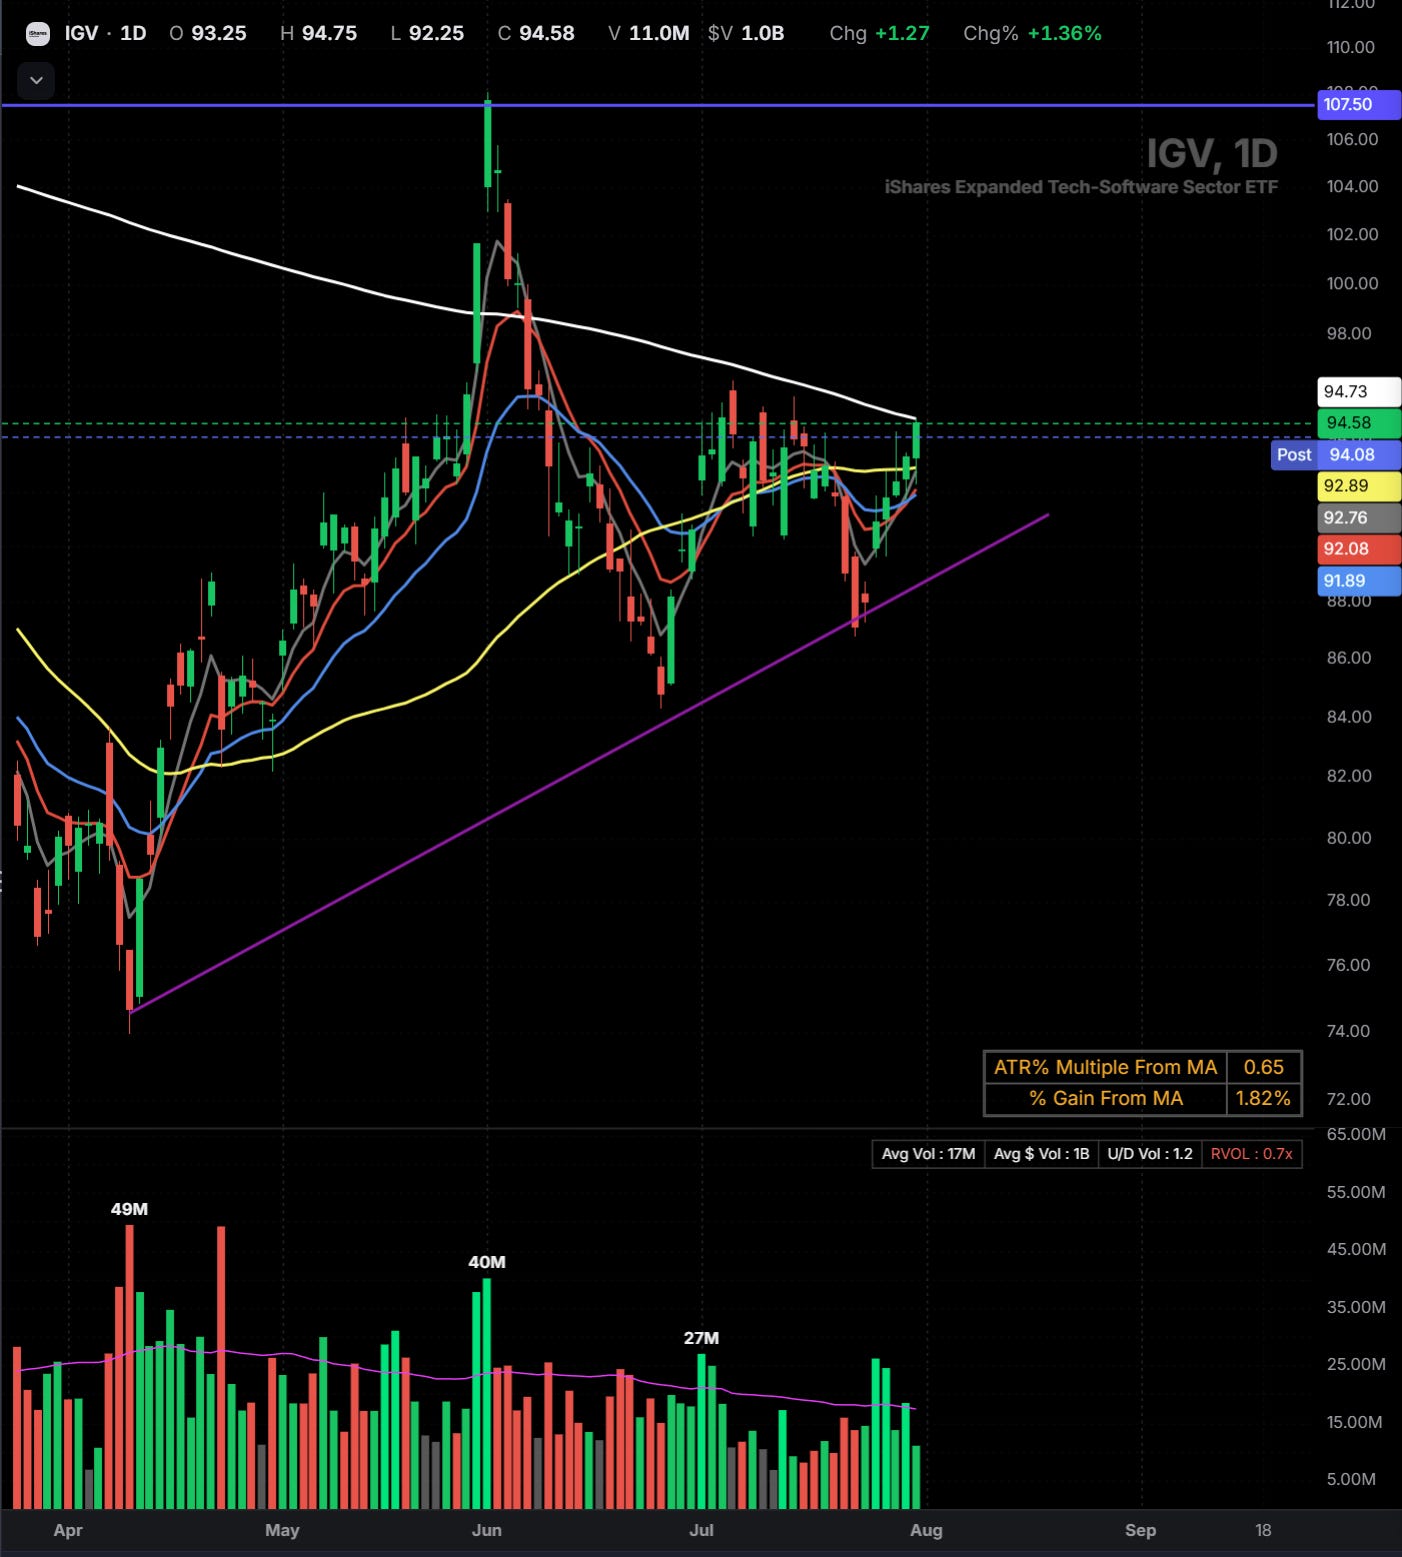
Cybersecurity ($CIBR) is its own animal with an incredibly strong looking chart. We are focused on leaders $CRWD, $PANW. And inference is the new fourth bucket, the business of actually running AI models, which is where the next wave of spend goes after the buildout.
The AI angle splits the group in two. Usage-billed names get paid more every time an AI workload runs. Per-seat names have to prove AI doesn’t shrink the seat count. The market is already grading this. $NOW, the old textbook enterprise leader, sits more than 40% off its highs. Every name on our list is on the right side of that split.
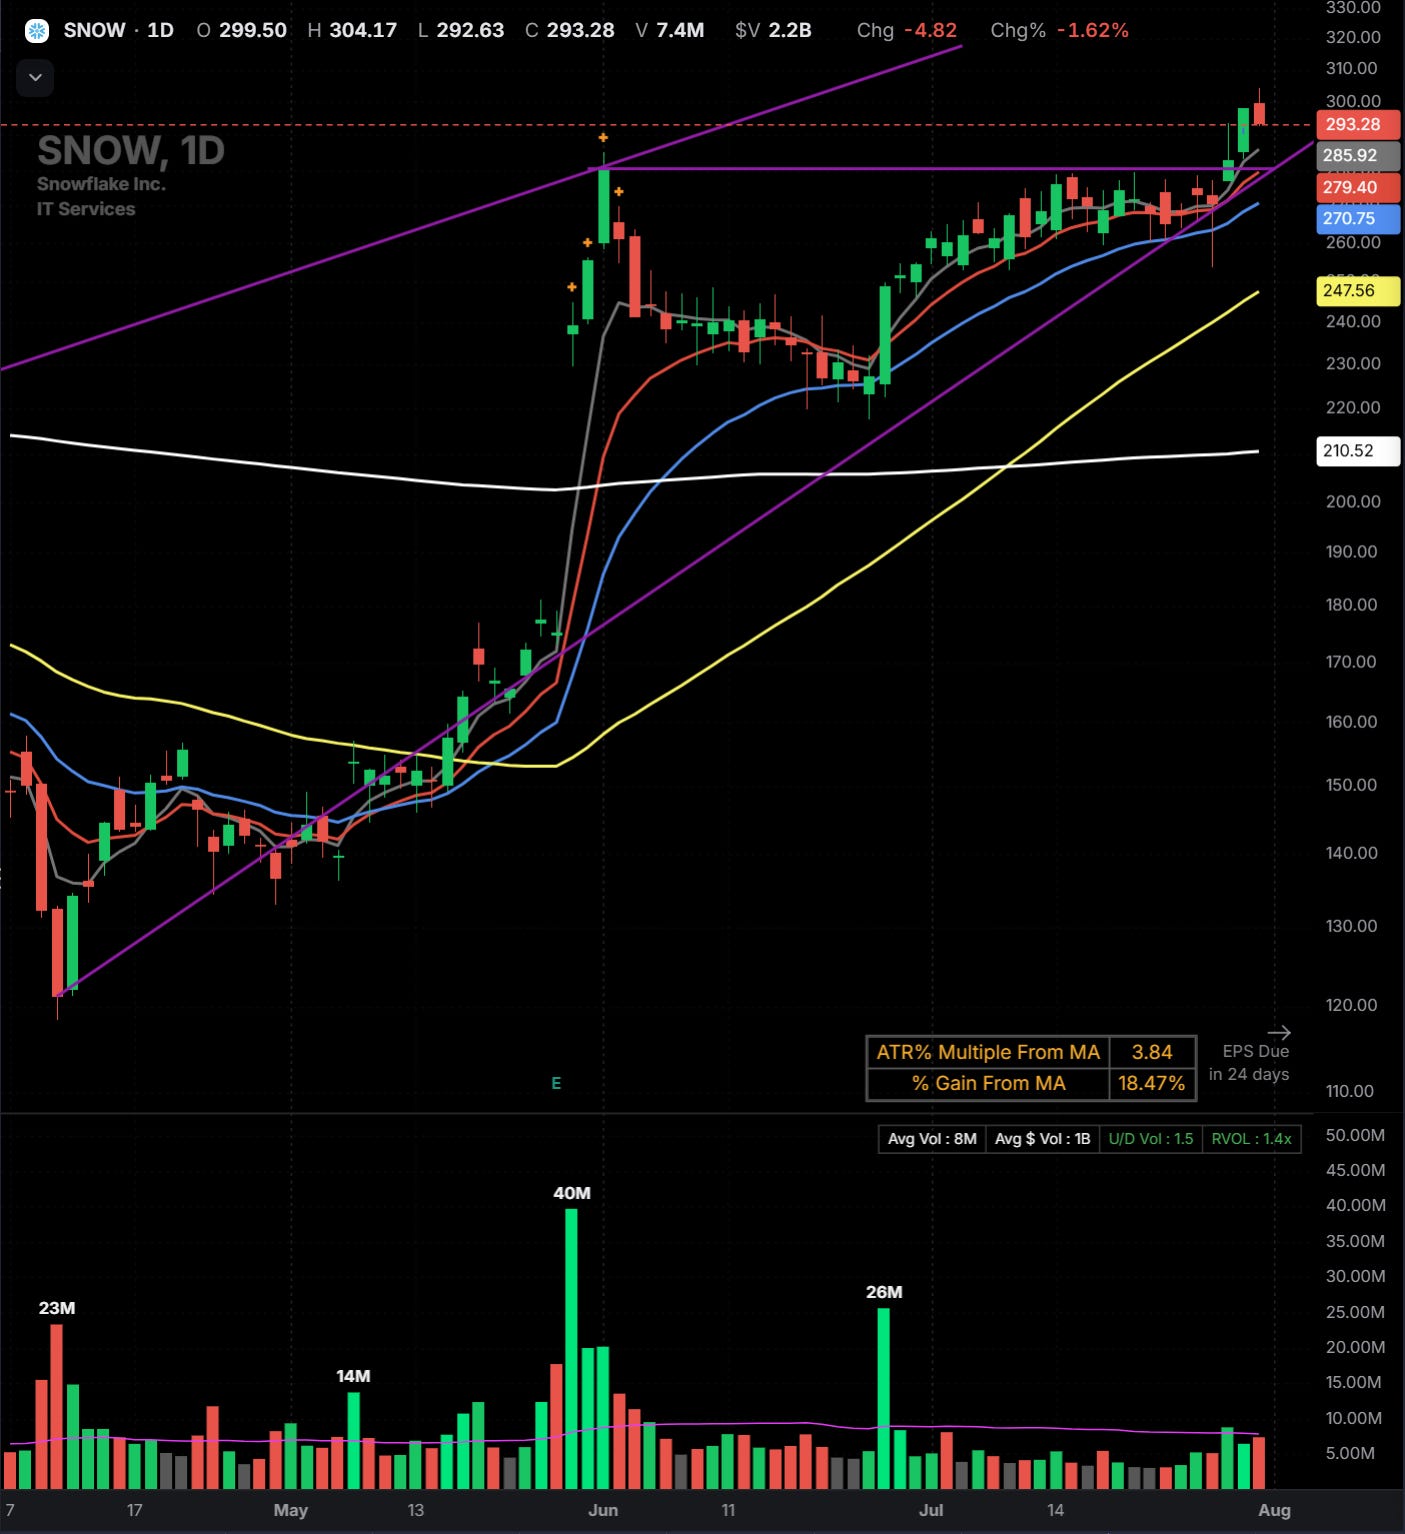
The charts agree. $SNOW closed 3.6% off highs, still the best chart in software, reports 8/26.
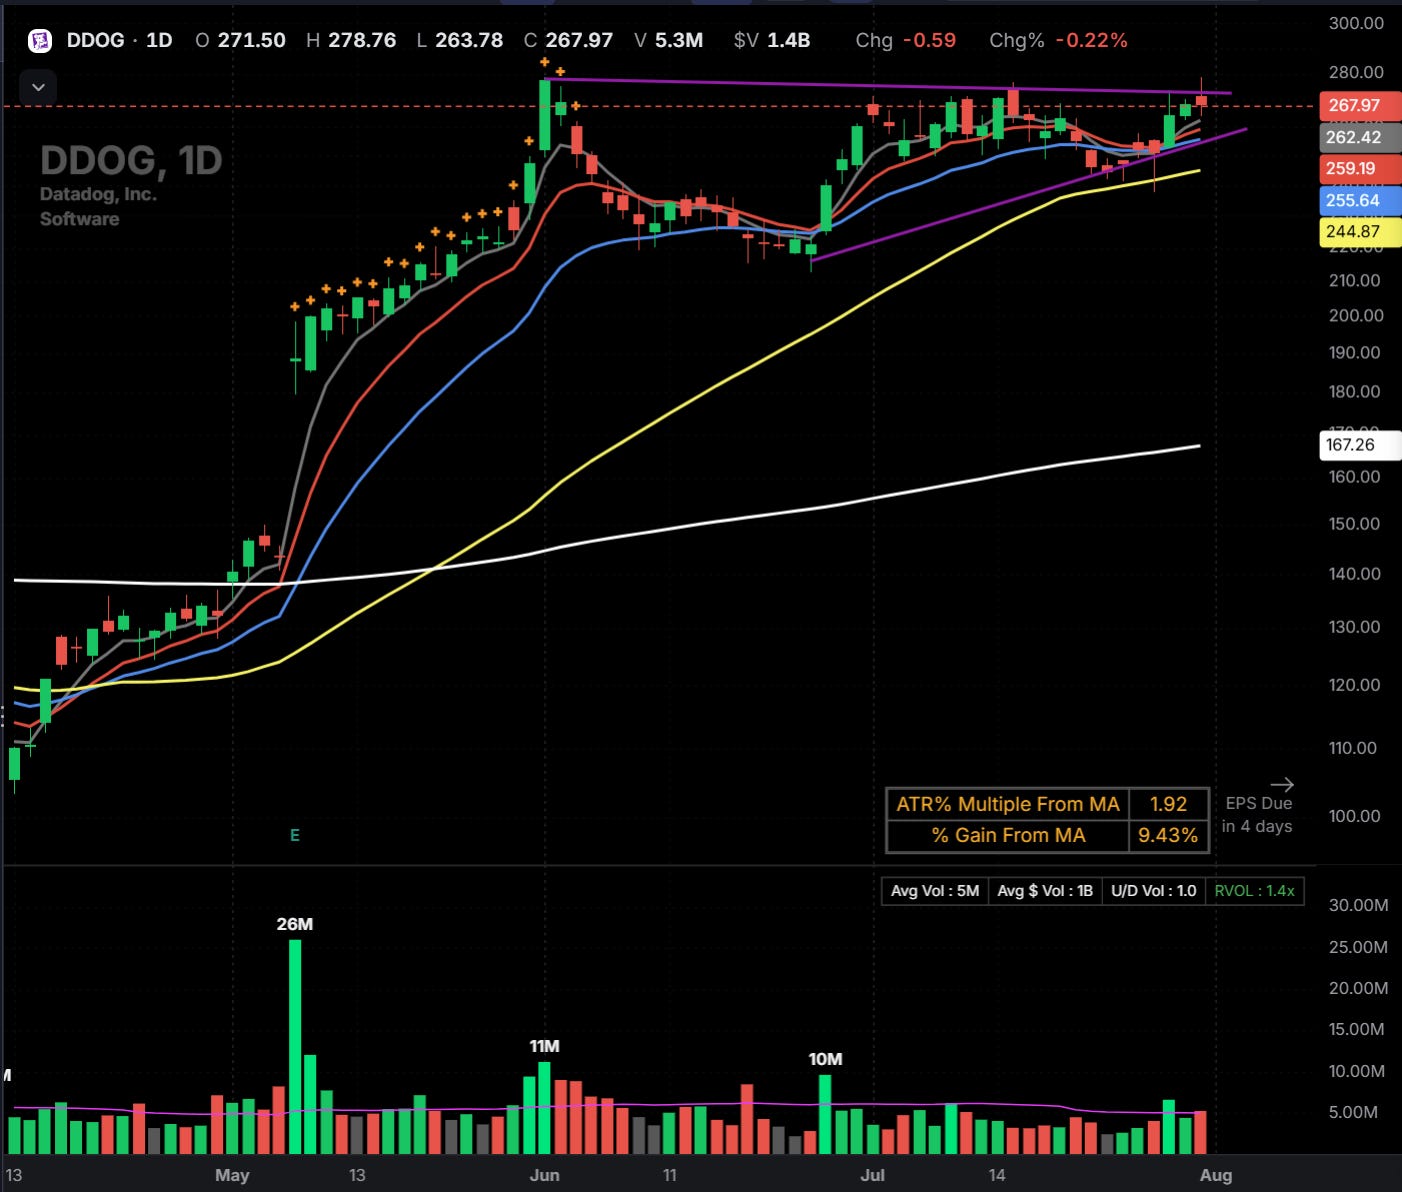
$DDOG closed at 268 with its 200-day back at 167, that’s the kind of year it’s having, and it monitors the AI apps everyone is shipping.
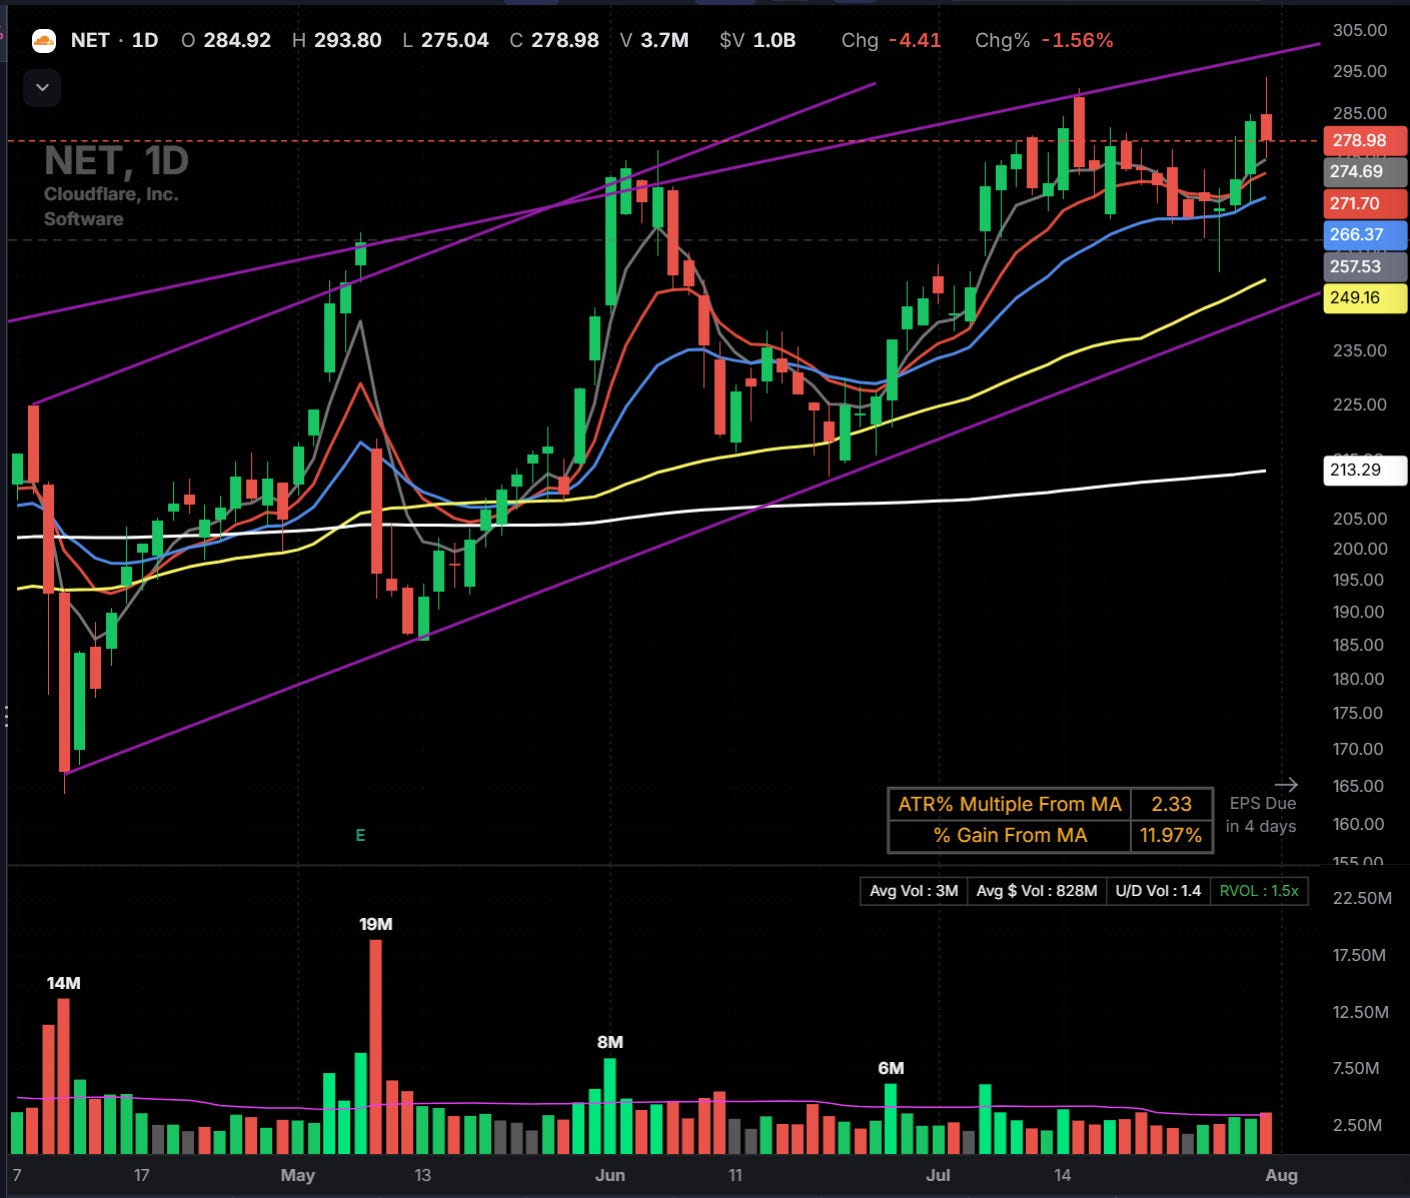
$NET is 5% off highs into its Thursday print. I covered the inference thesis Wednesday and nothing has changed: they handle close to 20% of the web’s sites and are the clear early leader in serving AI at the edge.
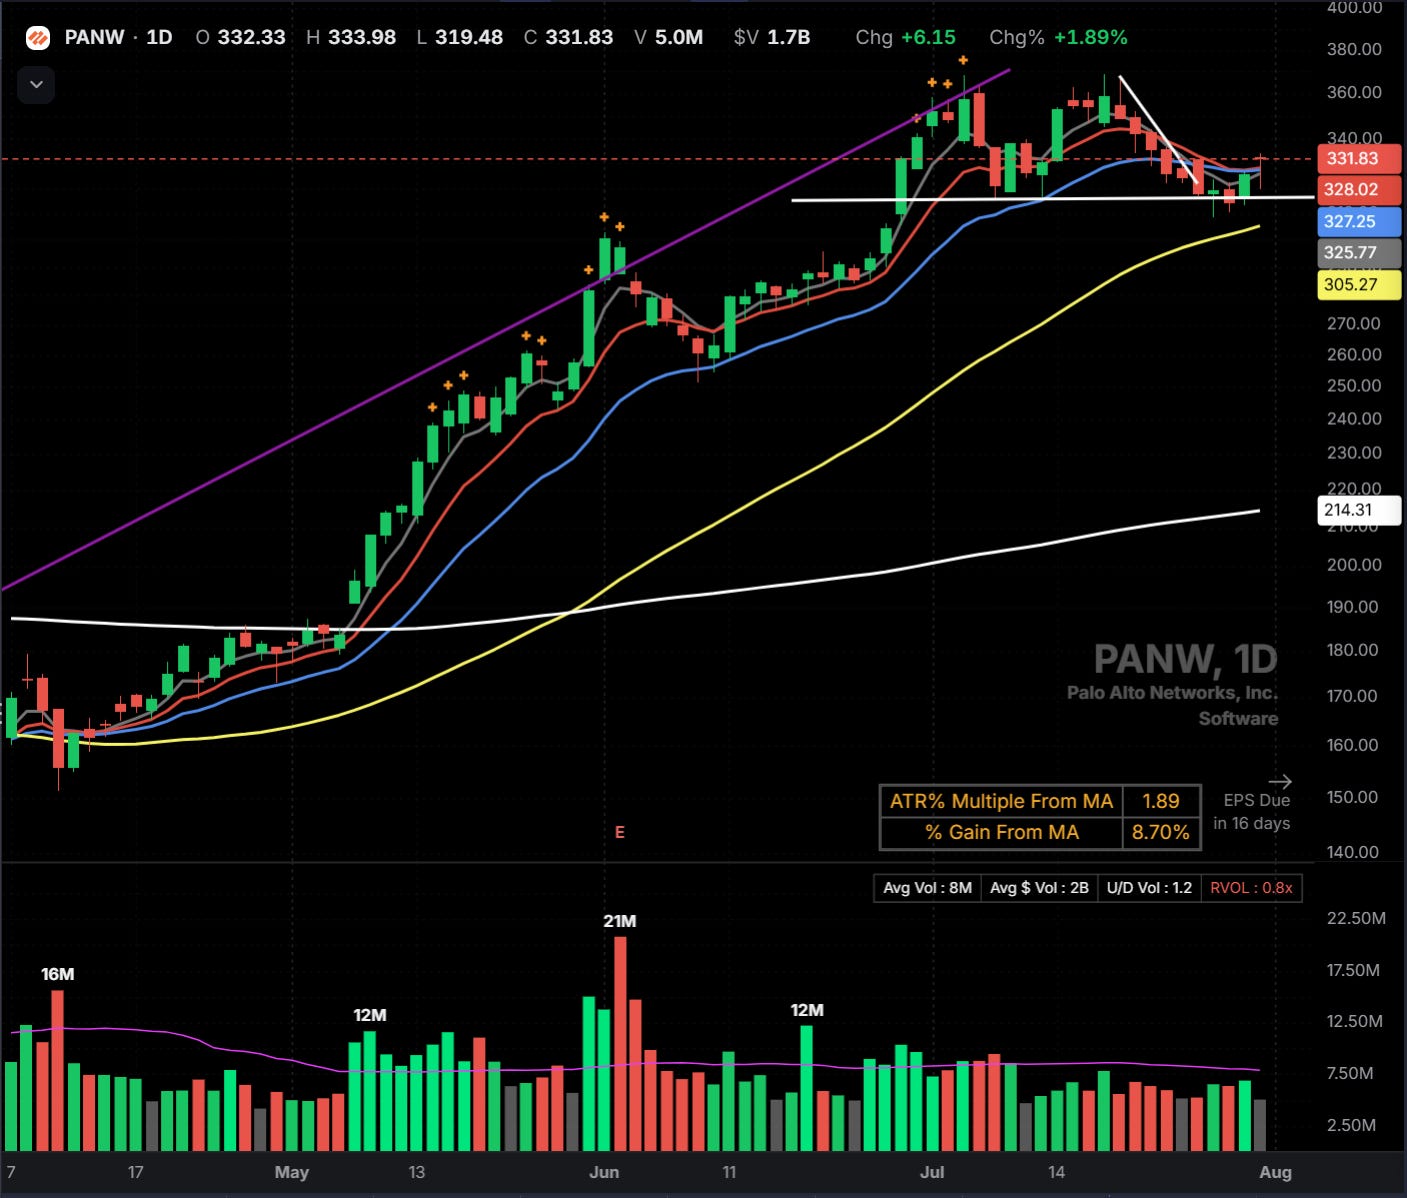
Security is quietly just as strong. $CRWD closed up 3% Friday, 12% off its highs, and $PANW is 10% off, now a $200B+ company. Both are consolidating dozens of point products into platforms, which is why the group compounds through everything. When CIOs get nervous about AI, security is the first check they write.
$MSFT is the tell for the whole complex. It corrected 16% off the 555 high, then reclaimed the 50-day and closed up 3% Friday. Azure is the biggest inference business on earth, so when $MSFT talks AI demand, the entire group moves. Watch it as the group’s regime gauge as much as a stock.
$RNG is the flyer on the list. A $4.8B phone-system company everyone left for dead, now up more than double off its 52-week low on an AI voice turnaround, 6% off highs. It is a different class of trade than the rest of this list. Thin, high beta, the momentum is the story. Size with respect.
What would change my mind: $IGV losing its relative strength against $QQQ, or the August prints getting sold. Four of these report this month, and $CRWD follows 9/1. We don’t chase into reports. The post-print pullbacks are where this list gets actionable.
THE BOUNCE TRADE: OVERSOLD PRIOR LEADERS
The other side of the tape is the old AI leadership. Memory took heavy red volume all week into earnings, and the forced liquidation of a major AI fund put massive reversal candles under $BE, $NBIS, and $SNDK. That’s the kind of flush that usually marks a tradeable low.
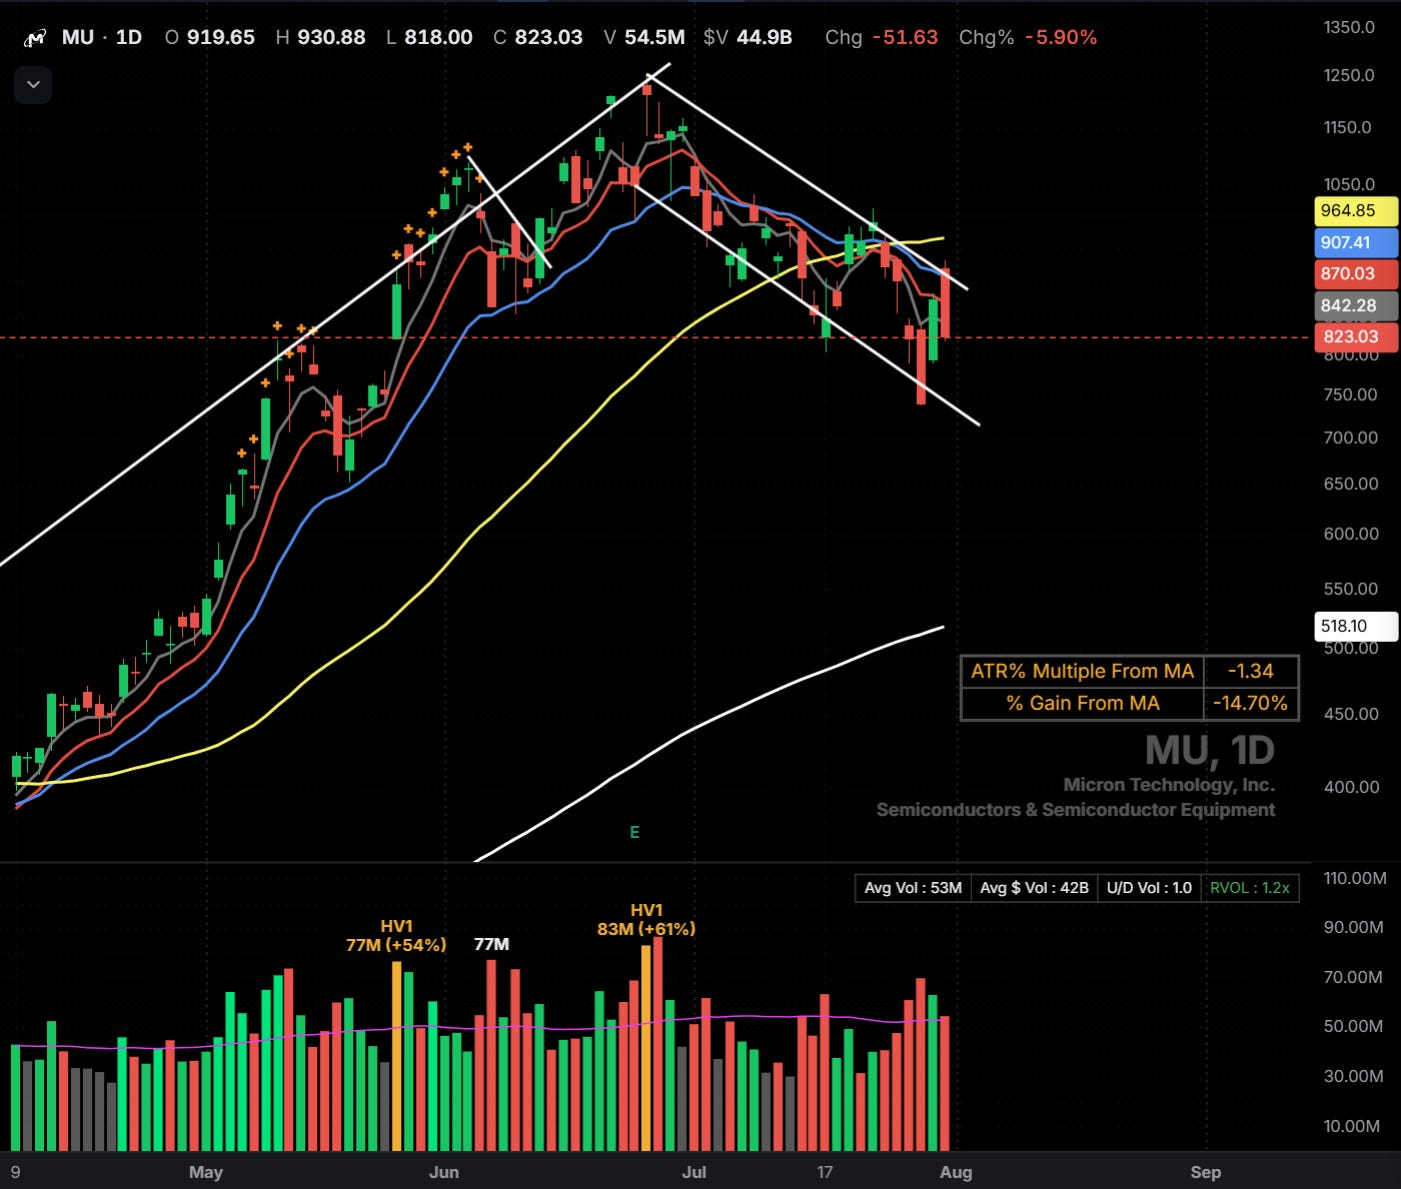
$MU is the cleanest example. At 823 it sits 34% off its highs with the 10-day up at 870 and the 21-day near 910. That’s a 6 to 10% bounce sitting right there if the market cooperates.
$NBIS and $BE are the same trade a step further along. Both already reclaimed their 10-days on the flush volume. $NBIS at 190 has the 21-day at 199, and its 8/12 report caps how long the trade gets. $BE at 206 has the 21-day near 220 and the real level at 230, and with no report until late October it’s the one bounce candidate with a clean calendar. Same terms for all of them: capped expectations, fast exits.
We’ll play these, but with expectations capped and exits fast. These are pullback trades in poor conditions, quick in and out, exactly the class our rules save for tapes like this. Broken charts carry overhead supply: every rally runs into holders waiting to get out at breakeven. The moving averages above are the target, not the launch pad.
Don’t expect to get very far. A bounce in $MU or the semis is a trade measured in days, not the start of new leadership. New leadership looks like $SNOW at highs, or $TER pushing through a rising 50-day. The oversold names earn their way back onto the real list the slow way: base for weeks, reclaim the 50-day, hold it. Until then these are rentals. And the calendar guards the door anyway: $AMD reports Tuesday, $SNDK Wednesday. Nothing before the prints.
THE LIST
$SNOW is the one we think could lead the market into this new rally IF it’s sustained. Very encouraging action all week.
⭐ $SNOW — the leader. All-time high Friday at 304.17 on the group’s biggest volume. ER 8/26.📍 Ideal: 292–296, holding the breakout zone · 🚀 Aggressive: 304.30, through Friday’s high · 🛑 Stop zone: 283–285
⭐ PANW 0.00%↑ closed 331.83, through the 326.40 level and above every moving average. ER 8/17. 📍 Ideal: 326.50–330 on the hold · 🚀 Aggressive: 334.10 · 🛑 Stop zone: 319.50, Friday’s low
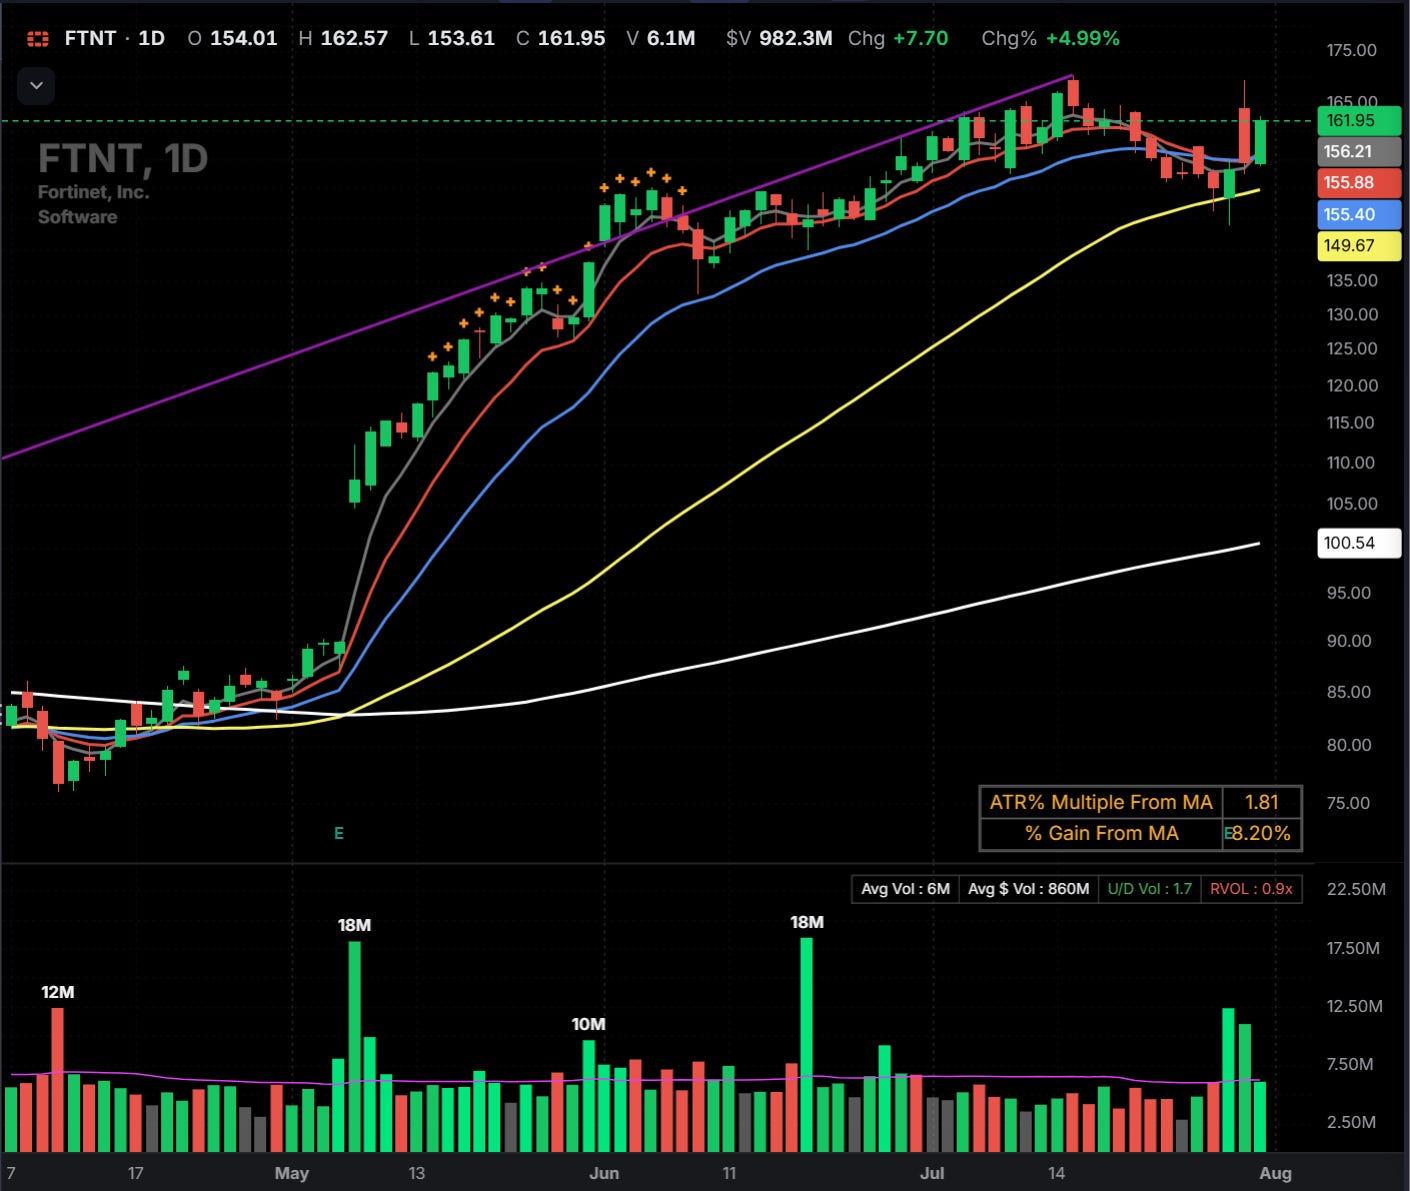
⭐ $FTNT — earnings behind it, failed gap repaired, closed stacked. ER not until November. 📍 Ideal: 158–160 retest · 🚀 Aggressive: 162.70 · 🛑 Stop zone: 153.60, Friday’s low
⭐$AMZN (leveraged vehicle: $AMZU) — the ROI rotation in one chart: +15% on its report, triple volume, 2.5% off all-time highs. Earnings pivot forming. 📍 Ideal: 265–268, first orderly pause at the gap zone · 🚀 Aggressive: 273.35, fresh highs · 🛑 Stop zone: 262, the gap-day low
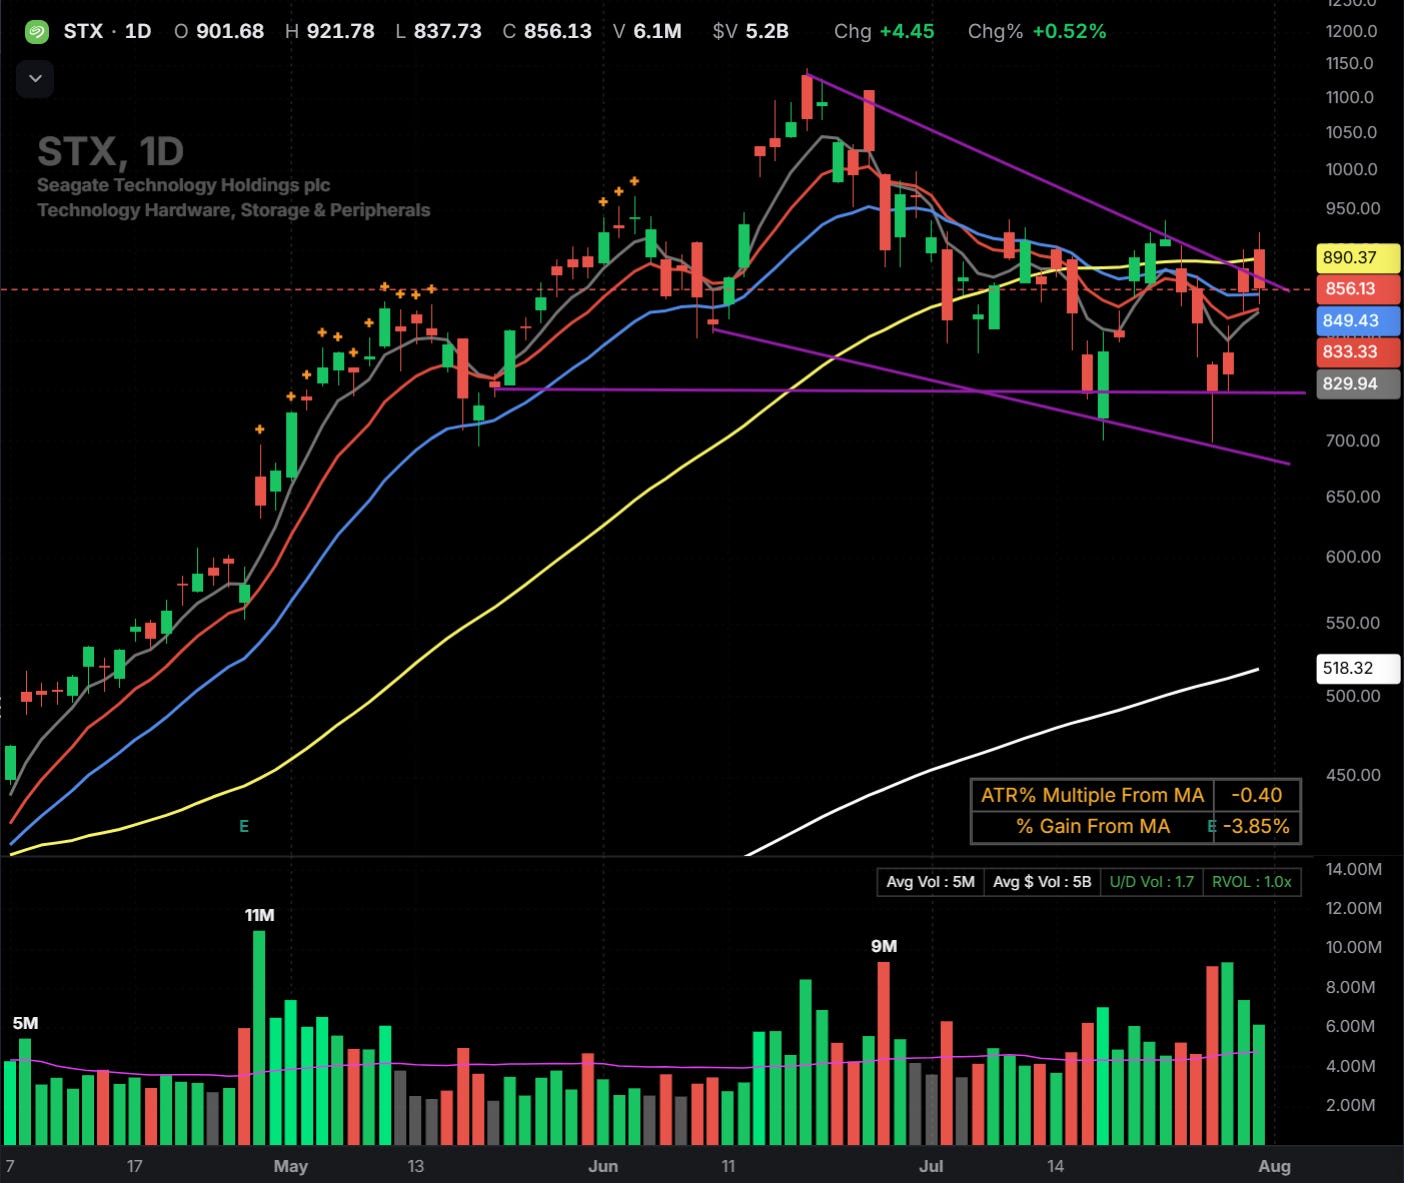
⭐$STX — basing under the 50-day inside the memory theme. Wild Friday (921 to 837 and back to 856) but the range held. ER 10/28. 📍 Ideal: 850–860 base · 🚀 Aggressive: 890.50, the 50-day reclaim · ➕ Add: 921.90 · 🛑 Stop zone: 837, Friday’s low
WATCHING, NOT READY
$MU — needs its 10-day back, ~870, before anything
$NET — post-earnings only, reports Thursday. 291 is the line after the print
$DELL — needs to reclaim the 10/21-day around 408–410 first
$TER — 380, the rising 50-day
$BE — 230 is the real level
$NBIS — the 21-day at 199, reports 8/12
$HUT and $AMD — both report Tuesday. After the print
$RNG — quiet base 6% off highs, 59.10 is the door
$GDXU — only if GDX holds 72.18
TRIGGERS THIS WEEK
Tuesday: the follow-through-day window opens. A 1%+ index gain on strong volume and we scale up, one position at a time, from the one name we hold toward four or five.
The QQQ ladder: 697, then 715. Reclaim the 50-day and we will be very happy.
The veto: 30-year yields or oil breaking out puts everything above back on hold, no matter how good the charts look.
The earnings gauntlet: $AMD and $HUT Tuesday, $SNDK Wednesday, $NET and $DDOG Thursday. $NBIS follows on 8/12. We don’t front-run prints. We trade what they leave behind.
FINAL THOUGHTS
July was a bad month for the market and a good month for the process. We sat out the chop, took one trade on the last day, and it’s already working. That patience wasn’t fun. It rarely is.
This week the market gets to vote. If Tuesday gives us a real follow-through day, we start pressing, one name at a time, right down the list above. If it doesn’t, we keep doing what we did in July and wait.
Either way, you’ll hear it from us the minute it happens.
See you in the chat.
— Nick
If you’re new here: the complete system behind every level in this letter posted yesterday. Ten minutes, eight rules, nothing held back. Read it here: THE RIDE THE LEADERS TRADING SYSTEM