
Expect a Rip This Week. Don't Trust It.
Sunday Letter: 7/26/2026. Oversold into the biggest earnings week of the quarter. The setup for a rally is here, but 8 distribution days say they get sold. Here is the playbook.

Market Regime: DEFENSIVE — STILL MOSTLY IN CASH.
The AI selloff continued last week. The AI leadership that carried this bull market is finally breaking, as price levels for key semiconductor stocks broke this past week.
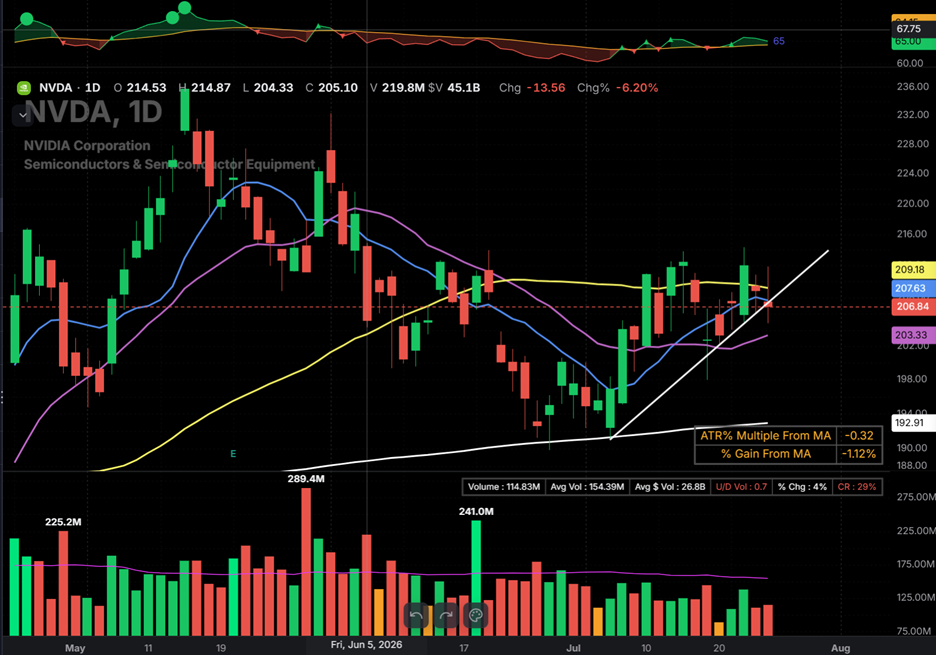
Leading stocks like NVDA, STX, & MU all rallied and then failed to stay above their 50-day — a very weak sign for the AI trade. That being said, we could see a bounce this week as the previous leaders try to reclaim their moving averages if we get good earnings or a dovish Fed meeting.
Eight distribution days shows institutions are likely to sell into any strength.
• AI leadership is clearly cracking while capital rotates toward broader sectors of the market like energy, steel, industrials, financials.
• I remain mostly cash until we get some resolution one way or the other.
This week I expect to see a bounce that is then sold into.
Some of the Semiconductor stocks that led this market higher from April to June are setting up for short entries as they failed to reclaim their 50-day moving average (MU/NVDA/STX).
We may go short if we see another failed retest of the 50-day on these.
This Week’s BEST Long Ideas (Potential Leaders on Watch)
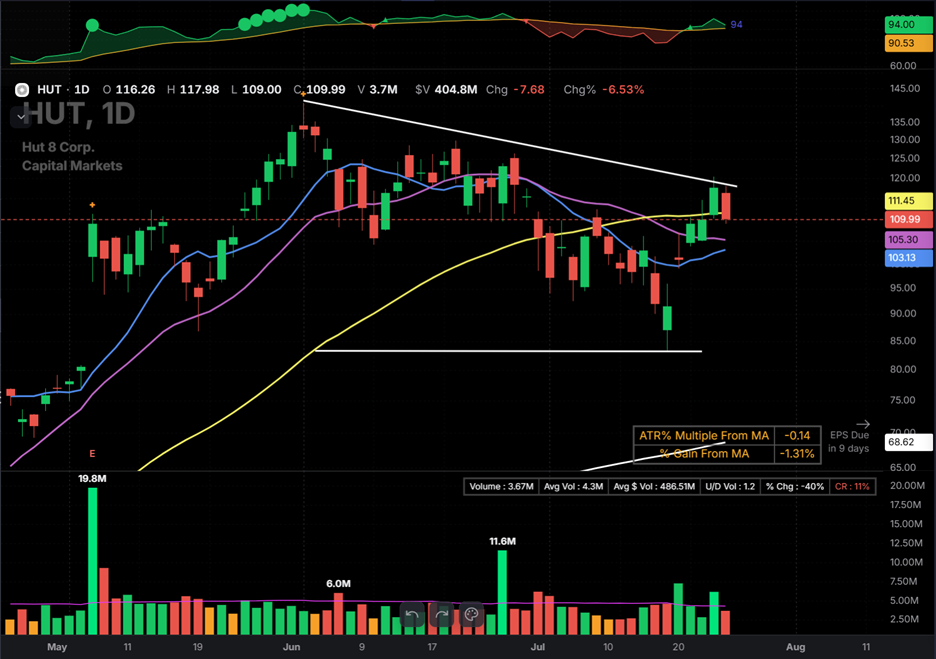
⭐⭐⭐⭐⭐ HUT · strong relative strength; the broader crypto miner group (WGMI ETF) seems to be firming up while other groups search for a bottom. HUT reports Tuesday 8/4, so the clock is short.
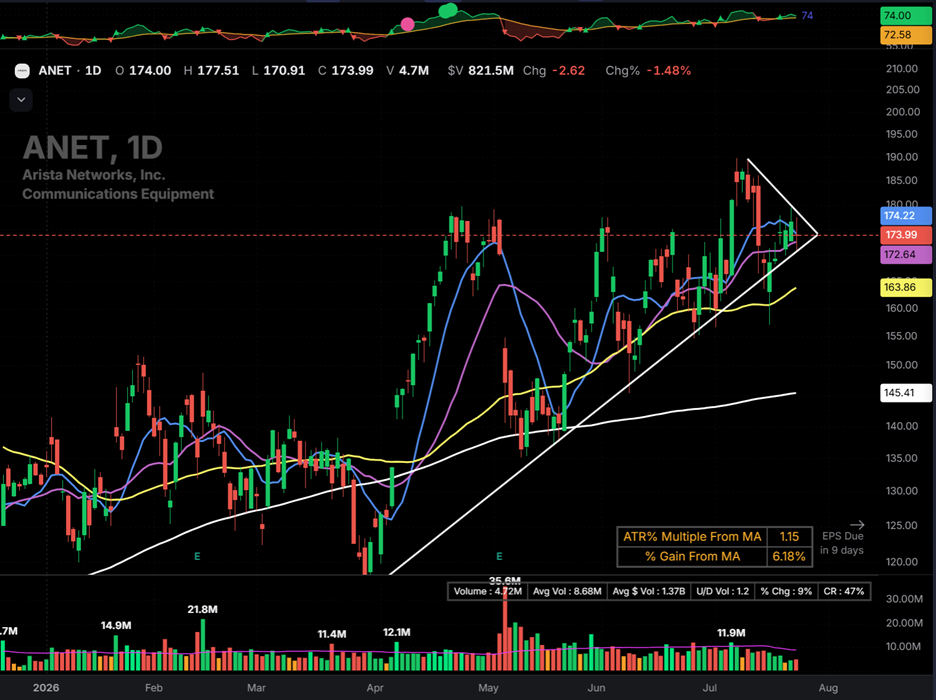
⭐⭐⭐⭐⭐ ANET · closed Friday sitting exactly on its rising 10-day. One of the stronger long structures on the list. Also reports 8/4.
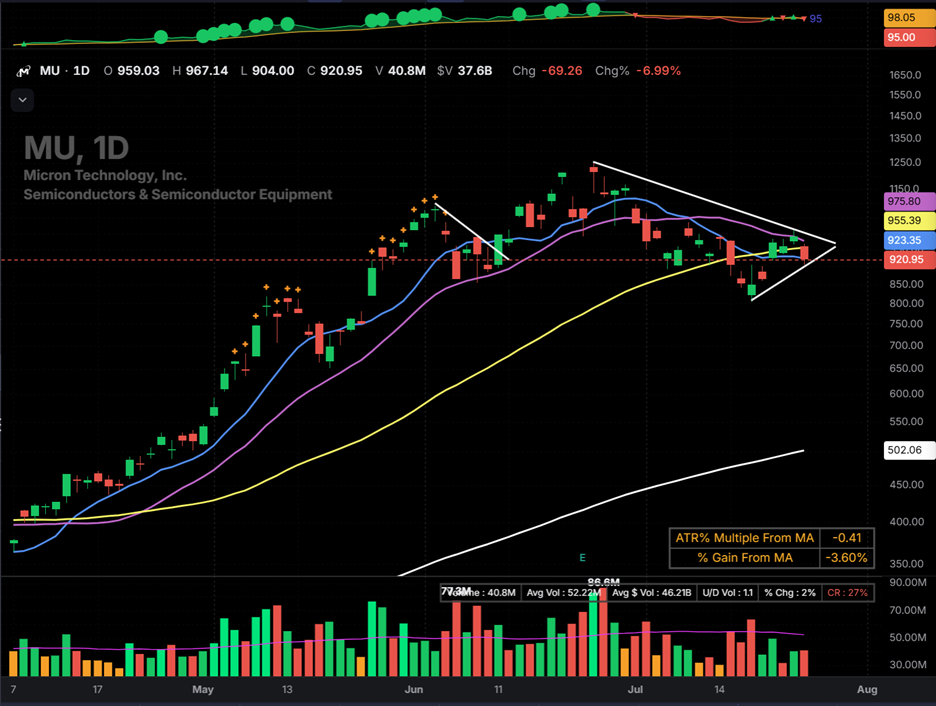
⭐⭐⭐⭐ MU · first higher low in the broken memory group. Ready to go long or short depending on action this week.
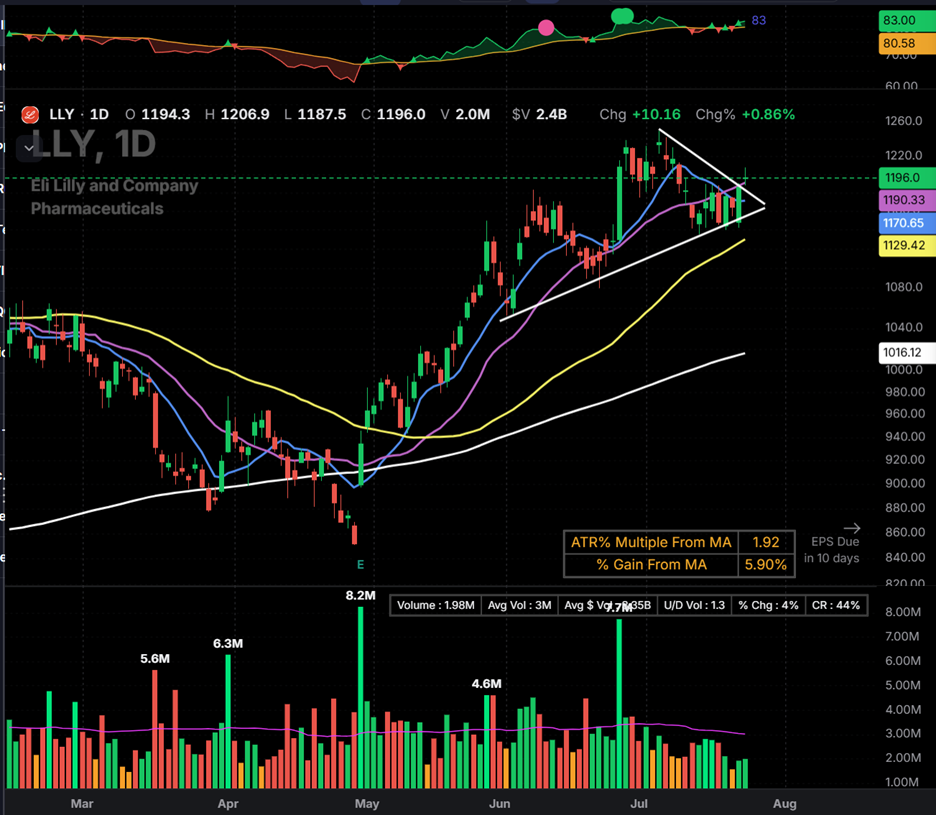
⭐⭐⭐⭐ LLY · the liquid leader riding its 10-day. Set up is strong. Reports 8/5.
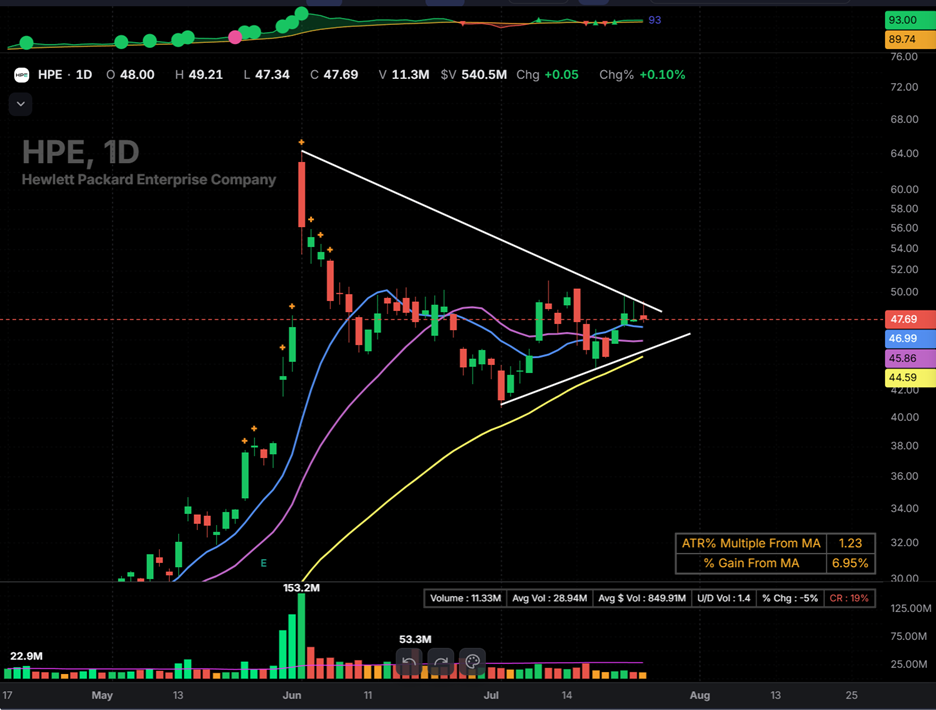
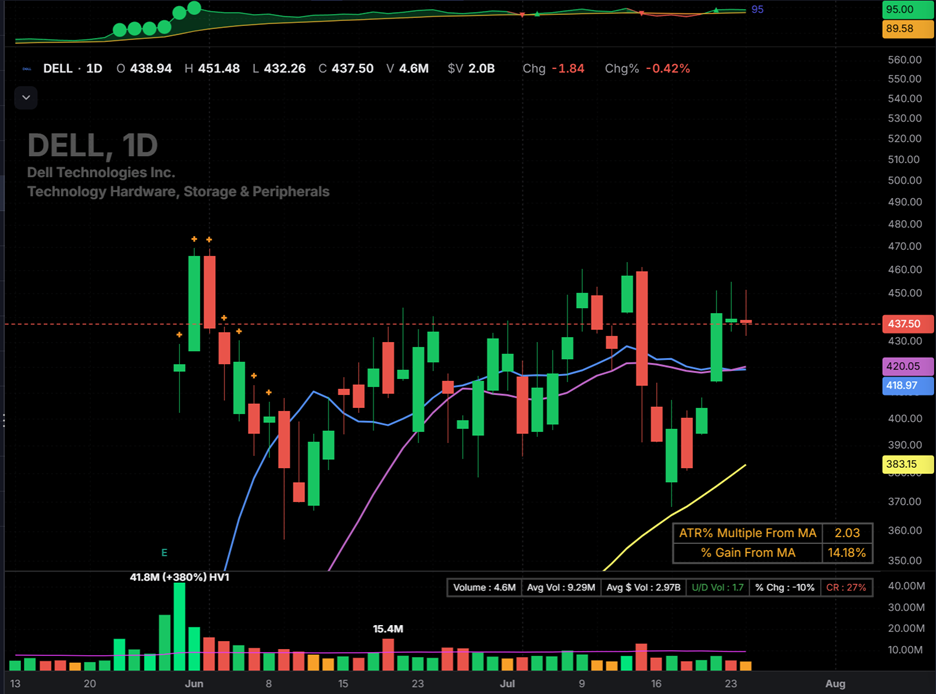
⭐⭐⭐ DELL / HPE · two beautiful hardware charts with real RS, flagging for now but watching for a set up.
I still view this as a defensive tape, and I’m mostly still in cash.
Most of these report within the next week. I typically don’t buy 3-4 days ahead of earnings and will sell before the print if I don’t have a substantial gain.
Set Up for a Rip Next?
Everything a sharp bounce needs is now on the table. QQQ filled the gap it left in early May and approaches oversold levels. Oil prices are down this weekend along with long-dated treasury yields. The 10-year yield looks ready to head lower, oil prices are lower over the weekend, while FOMC this week is stacked with data and the biggest earnings reports of the quarter.
Breadth quietly improved all week underneath the falling index: the equal-weight S&P finished the week flat while QQQ lost 1.6%.
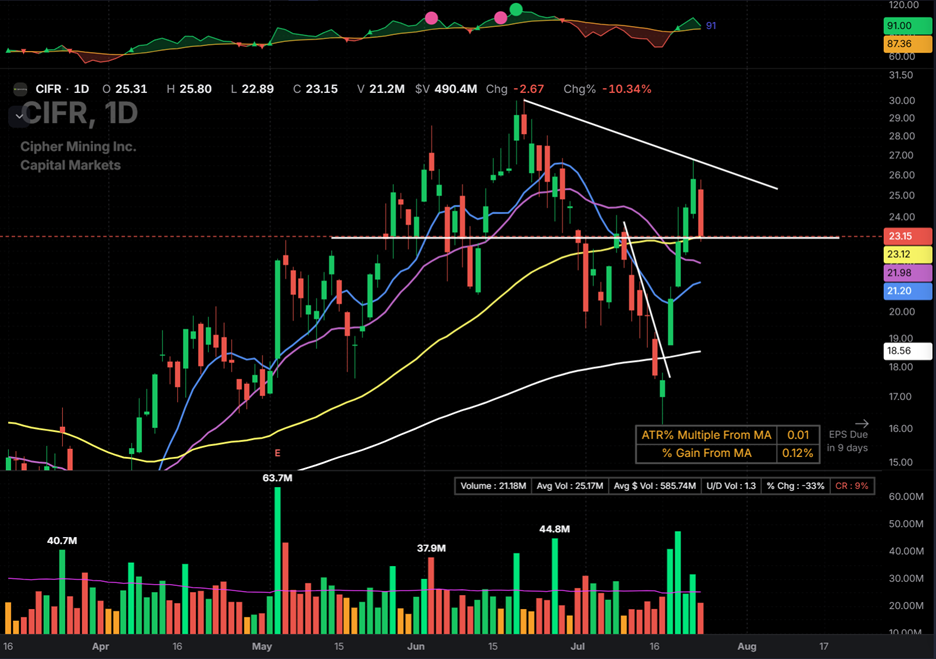
Something I’m watching closely — the bitcoin miners. They led this entire decline, and this week they stopped going down and reversed hard: HUT +20% on the week, CIFR +32%.
When the weakest group stops acting weak, the bounce is usually close.
So expect strength this week. Possibly violent strength. Good megacap prints into an oversold tape are exactly how face-ripping rallies start.
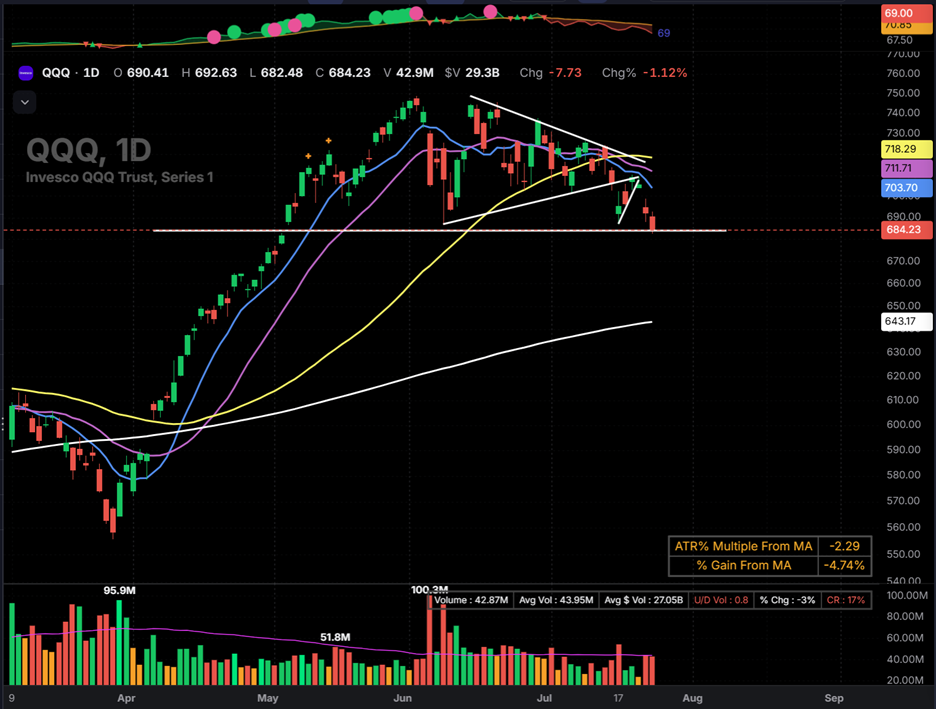
Eight Distribution Days Say: Don’t Trust It
Here is the other half, and it is the half that pays. Eight distribution days in a month is institutions selling rallies, systematically. That supply doesn’t disappear because the tape has a good week. It sells into it.
Wednesday’s letter said the leaders were rallying into resistance. Thursday was the rejection. The same logic now applies one level up: a rip runs straight into the 20-day near 708, then the 50-day near 718, with sellers layered at both.
The honest odds favor a strong bounce and then trouble, before any straight shot higher. What converts a rip into a rally is a sequence, and it hasn’t started: reclaim the 20-day, hold it, then take the 50-day on above-average volume without adding a distribution day. Until that sequence prints, I use rallies to grade the leaders. I don’t chase them.
Are active/institutional managers bearish? The most recent NAAIM print last week showed close to a 12% decrease in market exposure week over week (from 96% to 84%). Lets see how the next print on Thursday looks but were starting to see the beginning of what looks like some profit taking.
The Rotation Is the Real Story
The week’s defining stat — RSP finished flat while QQQ fell 1.6%. The AI trade is suffering while Industrials, aerospace and defense, homebuilders, steel, commodities, and financials all firmed while tech bled.
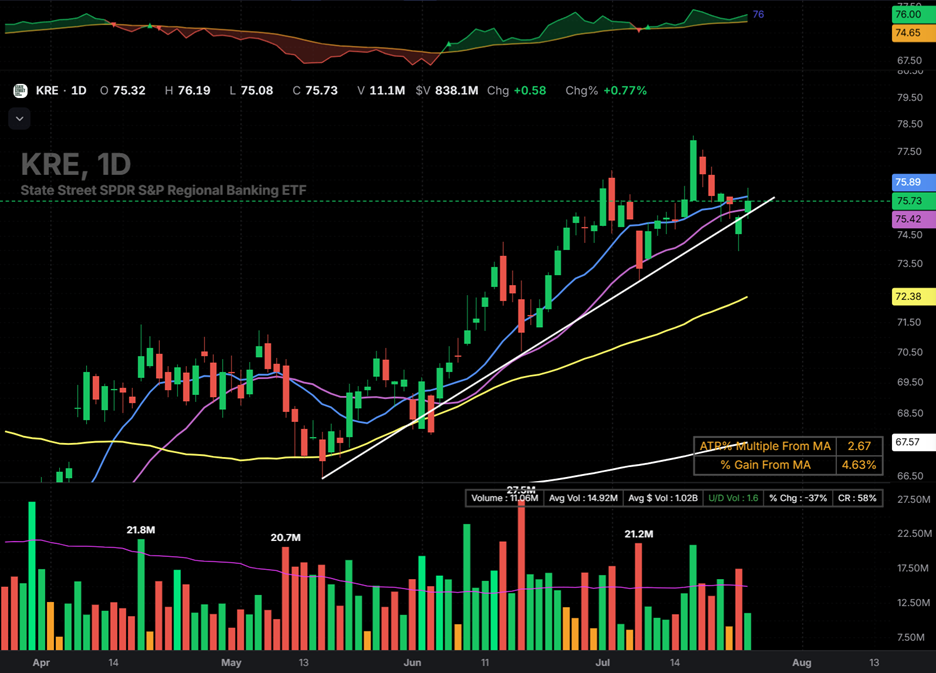
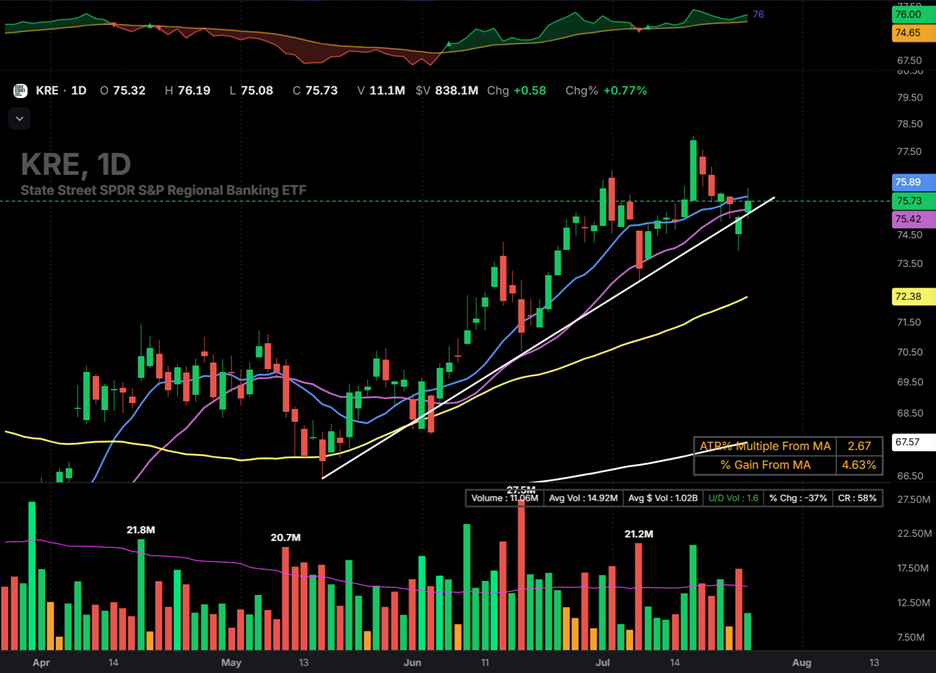
Rotating in: Energy ($XOP $USO $ERX, and they look like they want higher) · Regional banks ($KRE undercut its 20-day and a multi-month trendline and reclaimed both in the same week; strongest chart in the group, 3% from new highs) · Steel ($STLD) · Pharma and biotech ($PPH $IBB) · Copper ($COPX)
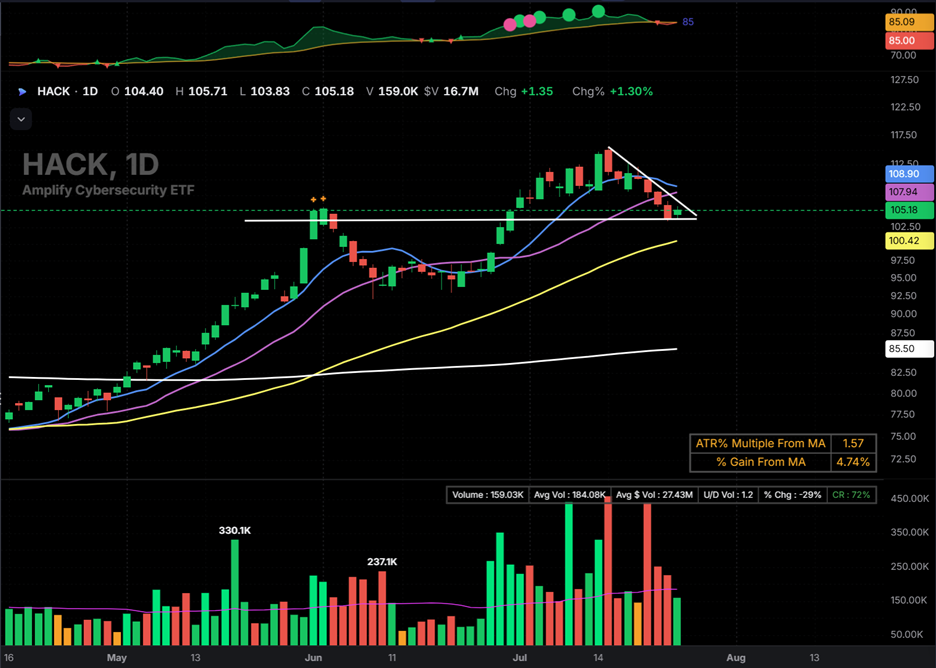
Cracking: Software. $IGV held up through July’s damage and finally got sold this week, down 5.2%. $DDOG fell all week before buyers stepped in Friday, 0.7% above its 50-day, before the line was even tested. $HACK gave back 5.3% after leading all month.
Still broken: AI memory and networking. No reclaims, no setups.
When corrections resolve, the next leg’s leaders come disproportionately from the groups that refused to go down. If the AI-trade disappointment continues through earnings, this list is where the money goes.
$HACK (cybersecurity) and $KRE (regional banks) are both looking incredibly strong here if they bounce here. Both beneficiaries of the rotation away from AI:
What I’m Watching Now
1 · The 20-day, ~708. The first domino of any repair. A close above it on volume starts the clock. A rejection there confirms the rip-and-fade read.
2 · Volume on the rip. A light-volume bounce into resistance is exactly what gets sold. Above-average volume through the levels is the only thing that changes my mind.
3 · Who holds their earnings gaps. The megacaps report this week, FOMC lands Tuesday and Wednesday, AAPL prints Thursday. A leader that gaps up and holds the gain is telling you about the next leg. A gap that gets sold by the close is the 8 distribution days talking.
This Week’s High Conviction Watchlist
The regime gate, stated plainly: in DEFENSIVE these are for watching, not buying. Levels are prepared in advance so the decision is already made if the market earns it.
HUT ⭐⭐⭐⭐⭐ · bitcoin miners · +139% YTD · reports Tue 8/4
Significant relative strength in the group that led the decline and just stopped going down, +20% for the week.
If the miners bottoming is the market’s tell, HUT is the strongest name giving the signal. Early week or nothing, and nothing gets held into the print without a real cushion.
📍 Ideal Buy Zone: higher low into the 10/20-day (~107) that holds, then the 50-day reclaim (~111.5) on volume
🚀 Aggressive: none. Not at 9.4% ADR with earnings days away
➕ Add-on: not before the print
🛑 Stop Zone: ~102, below the 10/20-day shelf
ANET ⭐⭐⭐⭐⭐ · AI networking · +33% YTD · 8% off highs · reports Tue 8/4
Closed Friday at 173.99 with the rising 10-day at 174.00. Sitting exactly on the line while the market corrects, and the chart never broke. Inference demand keeps strengthening and the price-target hikes keep coming. Strongest structure on this page, with the same short clock as HUT; it reports 8/4.
📍 Ideal Buy Zone: higher low at the 10/20-day (174–172) that holds and turns
🚀 Aggressive: >189.60 on strong volume, only with the regime improving, and not inside the final pre-earnings sessions
➕ Add-on: first tight pullback after a range break, post-earnings
🛑 Stop Zone: ~164, the 50-day. Setup wrong below it
MU ⭐⭐⭐⭐ · AI memory · +223% YTD · 27% off highs · reports 9/22
The memory trade broke, and MU is the first name in it building a higher low: 804 at the July low, 858.90 the week’s low, both rising. Friday closed 2% under the 10-day at 941.69. Reclaiming that line and turning is the start of the repair, and the 20/50-day cluster at 955–958 is the second gate.
Only name in the top five with no earnings risk for two months. When this group fixes itself, its strongest name has historically led the way out.
📍 Ideal Buy Zone: the 10-day reclaim (~942) that holds and turns up
🚀 Aggressive: none. Repairs don’t get aggressive entries
➕ Add-on: reclaim of the 20/50-day cluster (955–958)
🛑 Stop Zone: ~880 zone; 858.90, the week’s low, is the line in the sand
LLY ⭐⭐⭐⭐ · healthcare · the liquid leader · 3.2% ADR · reports Wed 8/5
Riding its 10-day (1,178) with higher lows intact, in the group leading the rotation. One of the calmest, most liquid charts on the page. Reports Wednesday 8/5.
The 10-day hold is only actionable early this week, and the range break through 1,207 is realistically a post-earnings trade.
📍 Ideal Buy Zone: the 10-day (~1,178) holds and turns, early week only
🚀 Aggressive: >1,207 on volume, post-print
➕ Add-on: tight day above the range break
🛑 Stop Zone: ~1,165, below the 20-day. Character changed
HPE ⭐⭐⭐ · AI hardware · +99% YTD · tight flag · reports 9/2
Same shape as DELL, a tight weekly flag in one of the last corners of hardware still printing real RS, riding the 10- and 20-day (46.9 / 46.5) quietly while the loud names break. It already showed you the failure mode this week: a light-volume poke that went nowhere.
The breakout is only real with the volume to prove it. No earnings until September, so this one keeps its full runway.
📍 Ideal Buy Zone: tight hold of the 10/20-day (47–46.5), then the break
🚀 Aggressive: >50.31 on high RVOL only. No volume, no trade
➕ Add-on: first tight pullback after the break holds
🛑 Stop Zone: ~46, below the 20-day shelf
More conditional charts I’m watching….
NVDA closed Friday right on its 10-day, still under the 50. It wants to move and the whole world is watching it. Only interesting through 214.40 on 200%+ RVOL; anything less is the crowd’s chop. Friday’s weak close came on light volume, noted, not damning.
· DELL is HPE’s bigger twin: >463.50 on high RVOL, wrong below ~417 (the 20-day).
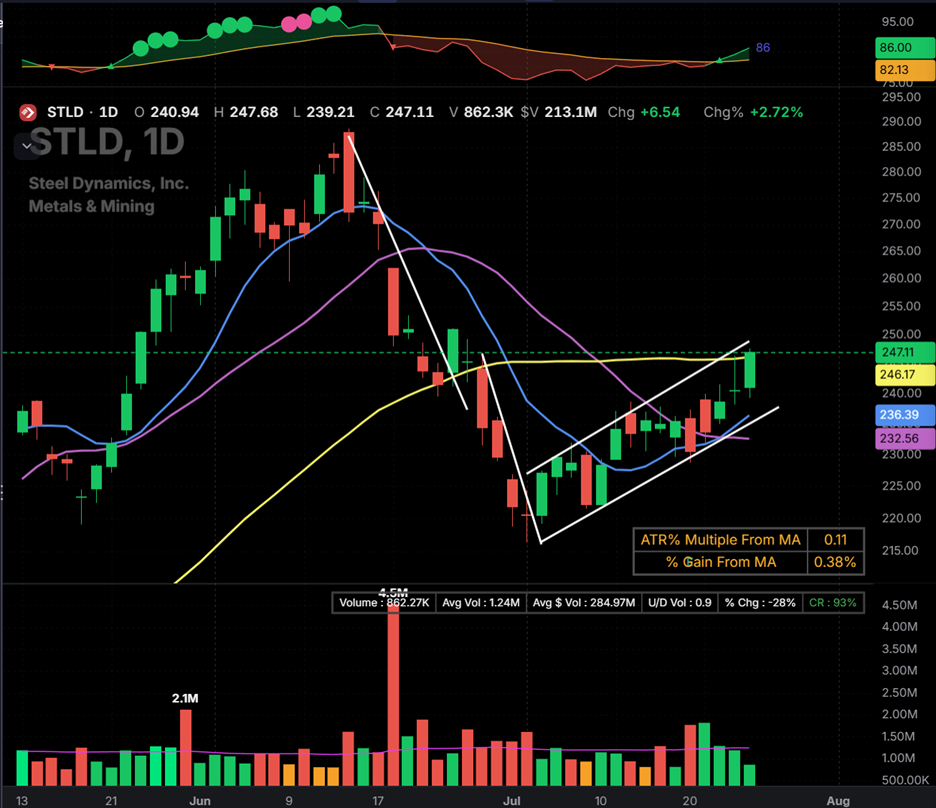
· STLD closed Friday back above its 50-day, 247.11 vs 246.17. Now it has to hold it, with volume expansion through Friday’s high at 247.68. Weak-volume drift above the line doesn’t count. Wrong below ~238.
· CIFR printed the sharpest V in the miner group, +32% on the week, back above every key MA. Let it flag first, then the flag high on volume. It reports 8/4, same clock as HUT.
· KRE is the rotation’s strongest chart: holds the 10-day (~75.7) and pushes through 78.10 into new-high ground. The hiding place if AI keeps selling.
Watching, Not Ready
DDOG · buyers defended 0.7% above the 50-day (~240) before the line was even tested. First test in months, if it comes, probably fails. Watch the defense, don’t join it. Reports 8/6.
SNOW · closed Friday on its 10-day with volatility and volume compressing. Watching for the turn.
AAPL · the safety trade, 0.6% off all-time highs while the rest of the MAGS wobble. Reports Thursday. The 10-day (~324) after the print. Never the chase into it.
VG · rotation beneficiary marching up its 10-day (~13.9). The dip that holds the line is the context.
DPC · screens top-decile RS, recent UK IPO, earnings in two weeks. Strong fundamentals
NBIS · higher low intact, but Friday’s candle was loose, down 15%, and the shorts keep winning the close. Needs weeks of tightening, not days.
BE · an ugly chart that trades ugly. Sits under the key moving averages for weeks, then breaks out in one massive pop that headfakes every momentum trader watching. Friday it gave back 15% in a session, with earnings Monday. Same personality as NBIS. No setup exists here, in either direction, until after the print.
MXL · the week’s cautionary tale. The earnings pop ran to 94.55 and got sold for a 24% loss in a single session, Friday close 71.59, 44% off its highs, below every moving average. That candle is what “one massive pop” personalities do. Dead until it rebuilds, and rebuilds take months.
PENG · killed at the published 59 on Wednesday, now trying to build a higher low in the 52–54 zone. The repair runs THROUGH the 50-day overhead at 62, not off it. Earning its way back.
AMD · Wednesday’s five-star, and here is what changed: it lost its 10-day Friday with the rest of the semis and it reports 8/4. Structure is fine above the 505–507 zone, but there is no setup inside earnings week. Back on this list after the print.
ERX / oil · the frozen-rope trend is working until it isn’t, and ropes break fast. Ride it, respect the exit.
Final Thoughts
This week has rally written all over it. We’re oversold, the gap is filled, yields are stretched, and the biggest earnings of the quarter are on deck. Wouldn’t surprise me at all to see a lot of strength this week.
But I don’t trust it yet. We may make a few quick trades, but eight distribution days means institutions have been selling every rally for a month. One good week doesn’t change that. Real bottoms follow a sequence: reclaim the 20-day, then the 50-day, on strong volume. We haven’t even started step one.
So the plan is to let them rip. Watch which names hold their earnings gaps and which get sold into the close. The ones that hold are your next leaders, and I’d bet they come from the list above. That’s who I want to be buying when the sequence starts.
Last week I sat on my hands into the weekend. In this tape, that’s the trade.
See you Wednesday.
— Nick
Educational content only. Nothing in Ride The Leaders™ constitutes investment advice or a recommendation to buy or sell any security. Levels (”ideal buy zone,” “stop zone”) are analytical reference points describing each chart, not instructions, provided without regard to any individual’s circumstances. The author holds no positions in any security discussed as of publication. Trading involves substantial risk of loss. Past performance does not guarantee future results. Always do your own research. © Ride The Leaders™ · ridetheleaders.com