
Reading a Stock's Stage in Ten Seconds
Four stages, two questions, zero indicators — the filter that keeps you out of dying stocks. Learn the Leaders · Lesson 3

Every stock, at every moment, is in one of four stages.
Learn to name the stage in ten seconds and you'll never again buy a stock that's quietly dying.
That alone eliminates half of most traders' worst losses.
The framework comes from Stan Weinstein's Secrets for Profiting in Bull and Bear Markets — the closest thing technical analysis has to a law of nature.
You need exactly two things on your chart:
Price
A long-term moving average (the 30-week line on a weekly chart, or the 200-day on a daily — either works)
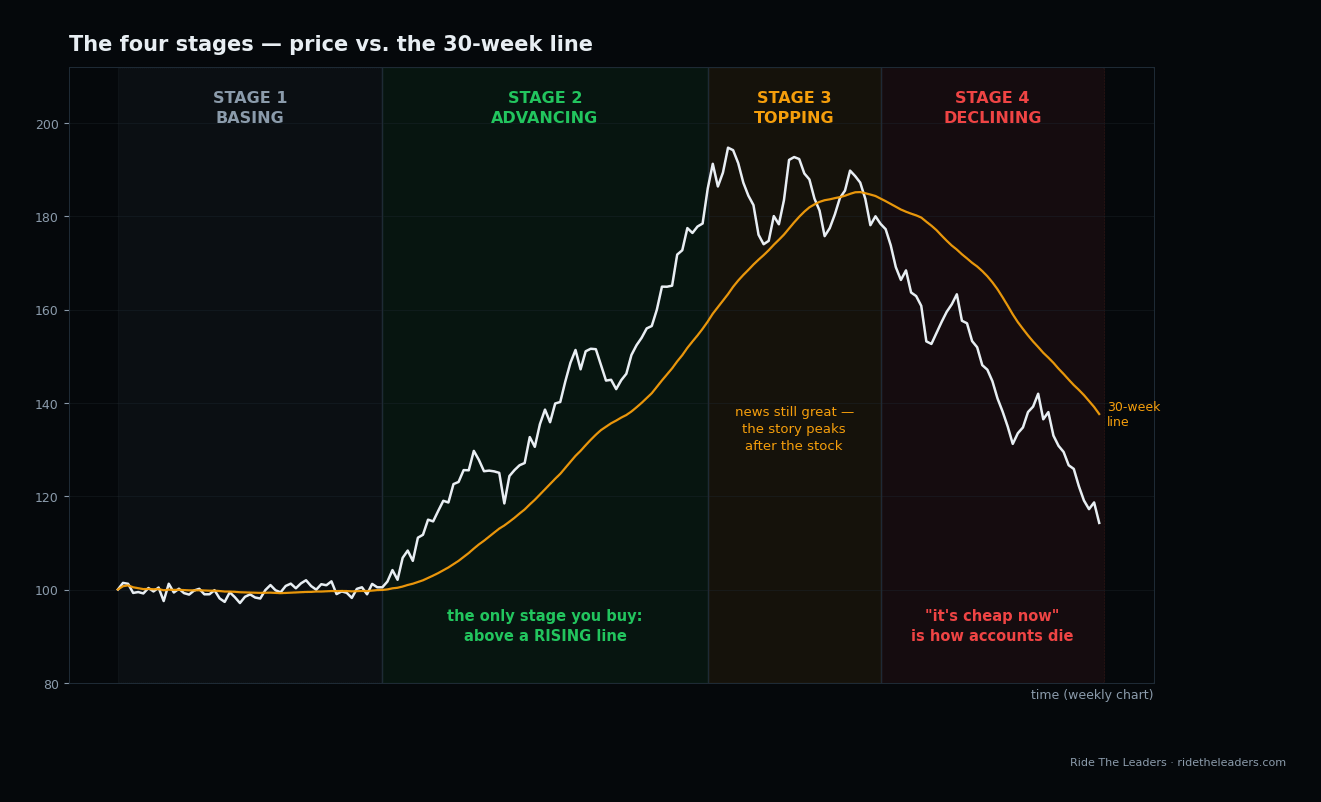
1️⃣ Stage 1 — Basing
The stock has stopped falling but isn't going anywhere.
Price chops sideways, back and forth across a flat moving average, on quiet volume. Nobody's talking about it. This can last months or years.
Not a buy — a stock waiting for a reason to exist.
2️⃣ Stage 2 — Advancing
The only stage you buy.
Price breaks out of the base on a clear jump in volume and now lives above a moving average that has turned up.
Higher highs, higher lows
Pullbacks find buyers at the rising line
This is the institutional accumulation from Lesson 02 — visible on one chart
The great growth stocks spend a year or more in Stage 2.
The entire job of a momentum trader: be long Stage 2 stocks in a Stage 2 market — and essentially nothing else.
3️⃣ Stage 3 — Topping
The advance stalls. Price starts whipping violently in both directions — big up days, big down days, no progress. The moving average flattens.
News is usually still great. That's exactly the trap: the story peaks after the stock does.
Volume on down days starts to swell. This is distribution — the institutions who bought in Stages 1 and 2 handing shares to the public.
4️⃣ Stage 4 — Declining
The mirror of Stage 2: price below a falling moving average. Lower highs, lower lows, every bounce failing at the line.
This is where "it's cheap now" destroys accounts.
A Stage 4 stock down 40% can go down another 60% — and the moving average overhead acts like a ceiling the whole way.
You never buy Stage 4. Not because the company is bad — because the supply of sellers hasn't been exhausted, and no one can tell you when it will be.
⏱️ The ten-second read
Two questions, in order:
Where is price relative to the long-term moving average? Above or below?
Which way is the moving average itself pointing? Rising, falling, or flat?
Above a rising line → Stage 2.
Below a falling line → Stage 4.
Tangled up with a flat line → Stage 1 or 3 (basing if it fell to get there, topping if it rose to get there).
That's the whole exercise. Ten seconds. No indicators, no opinions.
🎯 Why this matters so much
Because it's a filter that runs before everything else.
Earnings analysis, chart patterns, entry tactics — none of it matters if the stock is in Stage 3 or 4.
The stage check is how you make sure every hour of research is spent only on stocks where research can actually pay.
Our weekly watchlist enforces this mechanically: a name can't get near it unless it's above a rising long-term trend, near its highs — Stage 2 by construction.
📝 Try this yourself
Open charts for ten stocks you know — winners, losers, whatever you own now.
Weekly view
Add the 30-week moving average
Write down each one's stage using the two questions above
Then the uncomfortable part: if you're holding anything in Stage 3 or 4, write down the reason it deserves your capital more than a Stage 2 leader does.
"It'll come back" is not a reason. It's a hope — and Stage 4 is where hopes go to compound in the wrong direction.
Educational content, not investment advice. Ride The Leaders is an impersonal research publication.